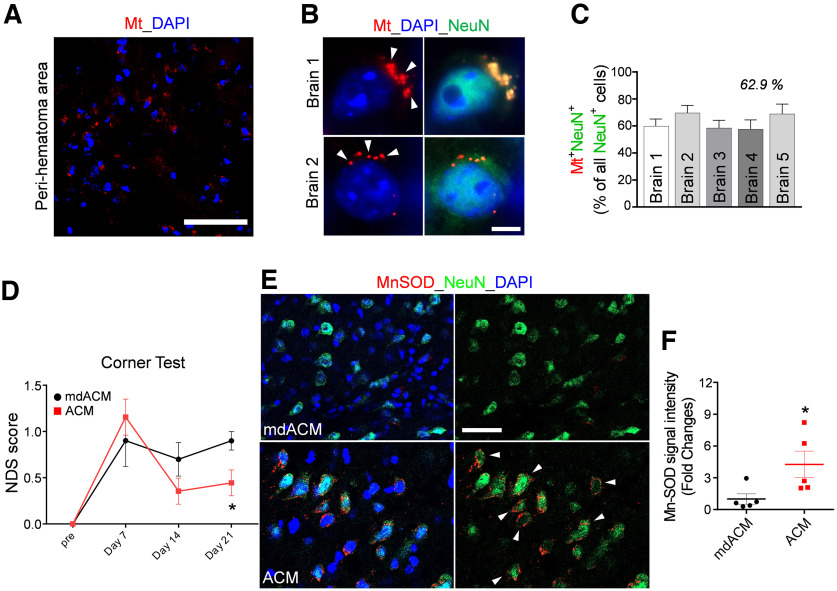
Figure 2.
Astrocytic Mt improves neurologic outcomes in ICH mice and restores Mn-SOD level in neurons in the ICH-affected hemispheres. A, B, The ACM containing MitoTracker-Red/CMXRos-labeled Mt (red) was intravenously injected at 24 h after ICH onset, and the animals were killed 24 h after Mt injection and processed for immunohistochemistry. A, Representative confocal microscopy image of the perihematomal area of the brain of mouse, which was injected with ACM containing MitoTracker-Red/CMXRos-labeled Mt (red). Nuclei were counterstained with DAPI (blue). Scale bar, 50 µm. B, Representative confocal microscopy image of neurons in the ICH-affected hemisphere (brains 1 and 2), which were injected with ACM containing MitoTracker-Red/CMXRos-labeled Mt (red). Arrows indicate Mt incorporated into neurons. Neurons were labeled with NeuN (green) and nuclei with DAPI (blue). Scale bar, 5 µm. C, The graph shows the percentage of neurons (NeuN+ cells) that are positive for astrocytic Mt in the ICH-affected hemisphere (collected from 2–5 fields per brain) as assessed for five independent mice brains (1–5). D, NDS established by corner turn test in ICH-injured mice that were intravenously injected with ACM or mdACM at 1 h, 7 d, and 14 d after ICH onset. The significance of NDS was assessed by repeated measures two-way ANOVA with multiple comparison and Fisher's LSD test (n = 8–9 per group), *p < 0.05 (p = 0.0431, ACM-treated mice vs mdACM-treated mice at 21 d), t value (t = 2.067). E, Representative images of immunofluorescent staining of Mn-SOD in neurons (NeuN-positive cells) in the ICH-affected area of the brain at 21 d after ICH in mice that intravenously received ACM or mdACM at 1 h, 7 d, and 14 d after ICH. White arrows indicate the cells showing high Mn-SOD (red) in the NeuN (green)-positive cells as result of treatment with ACM. Nuclei were counterstained with DAPI (blue). Scale bar, 40 µm. F, The dot graph illustrating the levels of Mn-SOD immunofluorescence signal intensity (measured in brain sections; 9 randomly selected fields per each brain) in the ipsilateral hemisphere of ACM-treated (red squares) versus mdACM-treated mice (black circles), as described in E; n = 5 animals per treatment group. The significance was assessed by two-tailed unpaired t test (n = 5 mice per group), *p < 0.05 (p = 0.0425, ACM-treated mice vs mdACM-treated mice), t value (t = 2.41). All data are shown as mean ± SEM. To test whether Mn-SOD level in ACM may affect protective effect of ACM, we also used ACMs from two populations of astrocytes that were exposed to Mn-SOD siRNA to deplete Mn-SOD or to scrambled siRNA (control). NDS was evaluated by the foot fault test in ICH-injured mice, which were treated with ACMs obtained from these astrocytes (Extended Data Fig. 2-1).

