Figure 3.
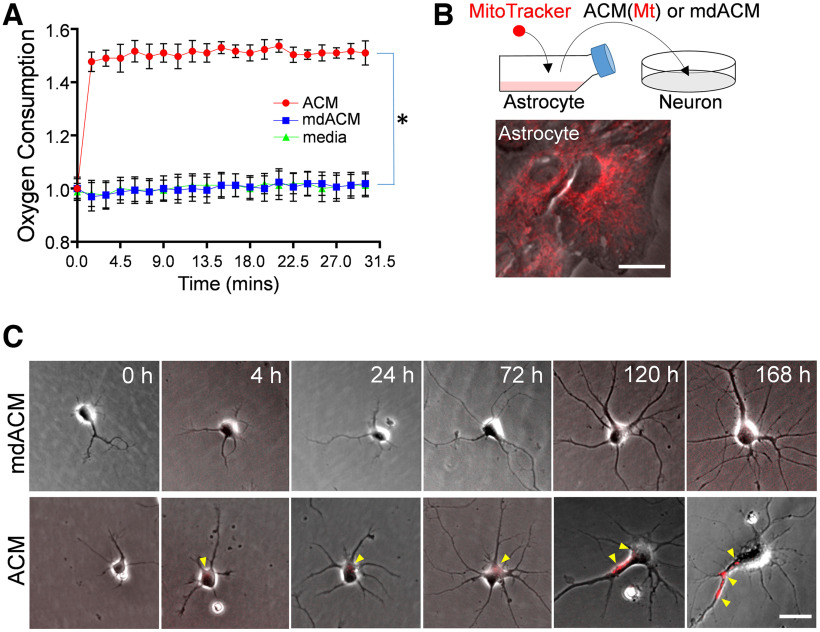
Mt functionality and neuronally incorporated astrocytic Mt moves along the axonal growth. A, Real-time oxygen consumption in ACM (red circles), mdACM (blue squares), and astrocyte culture media alone (DMEM with 10% FBS, as a negative control, green triangles); 20 µl O2 consumption reagent was added to 300 µl ACM, mdACM, or media in each well. The fluorescence was immediately measured every 1.5 min up to 30 min. Data are shown as mean ± SEM. Repeated measures one-way ANOVA assessed the significant changes in oxygen consumption with a multiple comparison test using Tukey's method (n = 3 per group), *p < 0.01 (ACM vs mdACM, q = 28.17). B, Schematic diagram of Mt transfer from astrocytes to neurons in vitro. Rat cortical astrocytes in culture were stained with 200 nm MitoTracker-Red/CMXRos to label astrocytic Mt, followed by washing and incubation in fresh media for 24 h. The medium was collected, half of the media was filtered to generate mdACM, and then ACM or mdACM was transferred to neurons in culture. Scale bar, 20 µm. C, Representative phase-contrast images of two rat cultured primary neurons, which were treated with ACM or mdACM. Images were captured at 0, 4, 24, 72, 120, and 168 h after treatment of ACM or mdACM. Yellow arrowheads point to MitoTracker-Red/CMXRos-labeled Mt incorporated into the neurons. Scale bar, 10 µm. Neuronally incorporated astrocytic Mt redistributes along the axonal growth (Extended Data Fig. 3-1).

