
Figure 6.
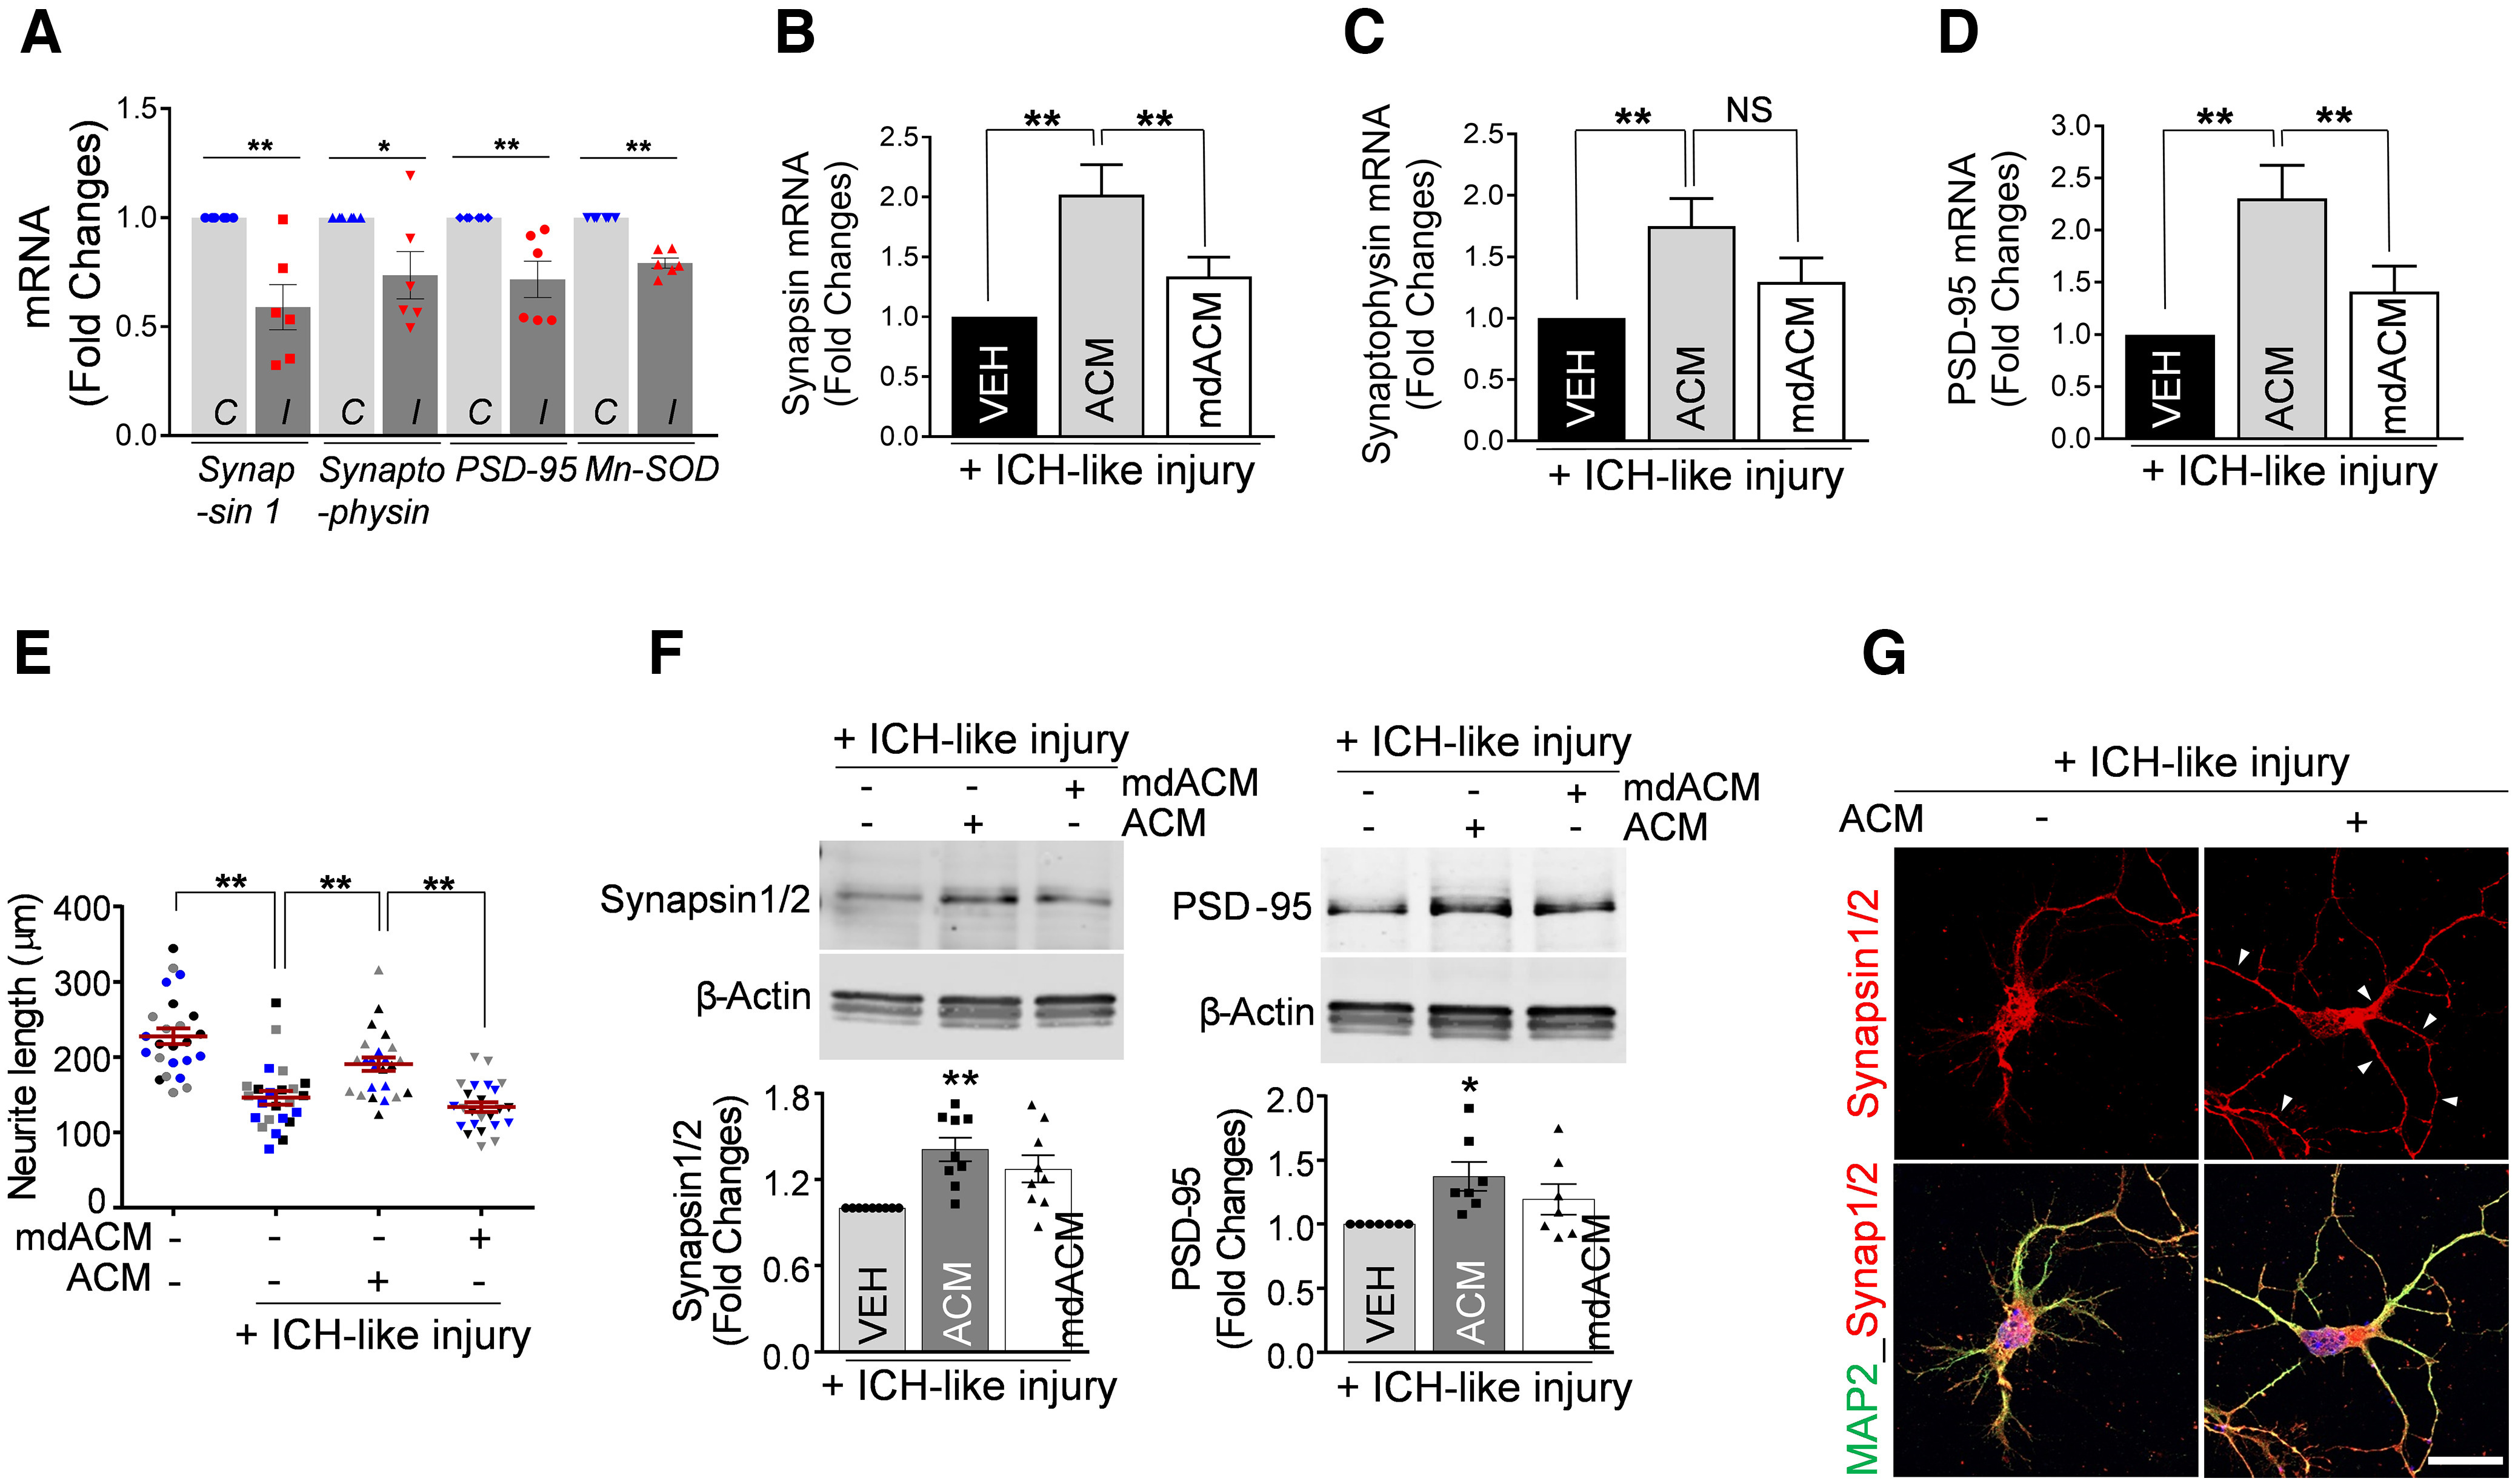
Astrocytic Mt upregulates the expression of synaptic plasticity-related genes and promotes neurite outgrowth under ICH-like injury. A, mRNA expression analysis for synaptic plasticity-related genes by qRT-PCR in cultured neurons (3.0 × 10⁵ neurons/well) subjected to ICH-like injury (I) in vitro (RBC lysates, 1.0 × 10⁷ RBCs/well) for 48 h versus untreated control (C). B–D, Cultured neurons were pretreated with ACM or mdACM for 24 h, followed by exposure to ICH-like injury in vitro (RBC lysates, 1.0 × 10⁷ RBCs/well) for 48 h. A, The significant loss of synapsin 1, synaptophysin, PSD-95, and Mn-SOD mRNA was calculated using two-tailed unpaired t test (n = 6 per group), synapsin 1, **p < 0.01 (p = 0.0028, C vs I), t value (t = 3.944); synaptophysin, *p < 0.05 (p = 0.0355, C vs I), t value (t = 2.43); PSD-95, **p < 0.01 (p = 0.0068, C vs I), t value (t = 3.4); Mn-SOD, **p < 0.0001 (C vs I), t value (t = 8.995). B, Values represent fold change of synapsin 1 mRNA levels compared with VEH plus ICH-like injury group. The significance in mRNA levels changes was assessed by one-way ANOVA/Fisher's LSD test (n = 9 per group), **p < 0.01 (p = 0.0003, VEH plus ICH-like injury vs ACM plus ICH-like injury), t value (t = 4.196); **p < 0.01 (p = 0.0098, ACM plus ICH-like injury vs mdACM plus ICH-like injury), t value (t = 2.807). C, Values represent fold change of synaptophysin mRNA levels compared with VEH plus ICH-like injury group. The significance in mRNA levels changes was assessed by one-way ANOVA/Fisher's LSD test (n = 13 per group), **p < 0.01 (p = 0.0039, VEH plus ICH-like injury versus ACM plus ICH-like injury), t value (t = 3.084), NS; Non Significant. D, Values represent fold change of PSD-95 mRNA levels compared with VEH plus ICH-like injury group. The significance in mRNA levels changes was assessed by one-way ANOVA/Fisher's LSD test (n = 12 per group), **p < 0.01 (p = 0.0003, VEH plus ICH-like injury vs ACM plus ICH-like injury), t value (t = 3.99); *p < 0.01 (p = 0.0099, ACM plus ICH-like injury vs mdACM plus ICH-like injury), t value (t = 2.737). E, Neurite outgrowth quantification in rat cortical neurons (5.0 × 10⁴ neurons/well) pretreated with ACM or mdACM, followed by exposure to ICH-like injury in vitro (RBC lysates, 1.7 × 10⁶ RBCs/well) for 96 h. Eight individual neurites in culture from each treatment group (3 independent replicates for each treatment condition) were manually traced, and the length of each neurite was measured using ImageJ software. The significance in neurite length changes was assessed by one-way ANOVA/Fisher's LSD test (3 different colors represent 1 of 3 independent experiments-biological replicates, n = 3). Data are shown as mean ± SEM. The mean was calculated by averaging three values for each experiment; **p < 0.01 (p < 0.0001, VEH vs VEH plus ICH-like injury), t value (t = 8.413); **p < 0.01 (p = 0.0018, VEH plus ICH-like injury vs ACM plus ICH-like injury), t value (t = 4.574); **p < 0.01 (p = 0.0004, ACM plus ICH-like injury vs mdACM plus ICH-like injury), t value (t = 5.87). F, Representative Western blot images and quantitating bar graphs showing synapsin 1/2 and PSD-95 protein levels in cultured neurons pretreated with ACM or mdACM for 24 h, followed by exposure to ICH-like injury in vitro for 48 h. The significant changes in synapsin 1/2/β-actin and PSD-95/β-actin protein levels were assessed by one-way ANOVA/Fisher's LSD test (n = 9 in synapsin 1/2 and 7 in PSD-95), **p < 0.01 (p = 0.0005, VEH plus ICH-like injury vs ACM plus ICH-like injury in synapsin 1/2/β-actin), t value (t = 4.023); *p < 0.05 (p = 0.0121, VEH plus ICH-like injury vs ACM plus ICH-like injury in PSD-95/β-actin), t value (t = 2.789). G, Representative confocal microscopy images of cultured neurons pretreated with ACM for 24 h, followed by exposure to ICH-like injury in vitro for 48 h. Synapsin 1 and 2 are shown in red. Neurons were stained with MAP2 (green). Nuclei were counterstained with DAPI (blue). Scale bars: 20 µm. Data are shown as mean ± SEM. Synap1/2, Synapsin 1/2. Synapsin 1/2 is increased in perihematoma area of the brain after ICH in mice receiving astrocytic Mt in vivo (Extended Data Fig. 6-1).