FIG. 1.
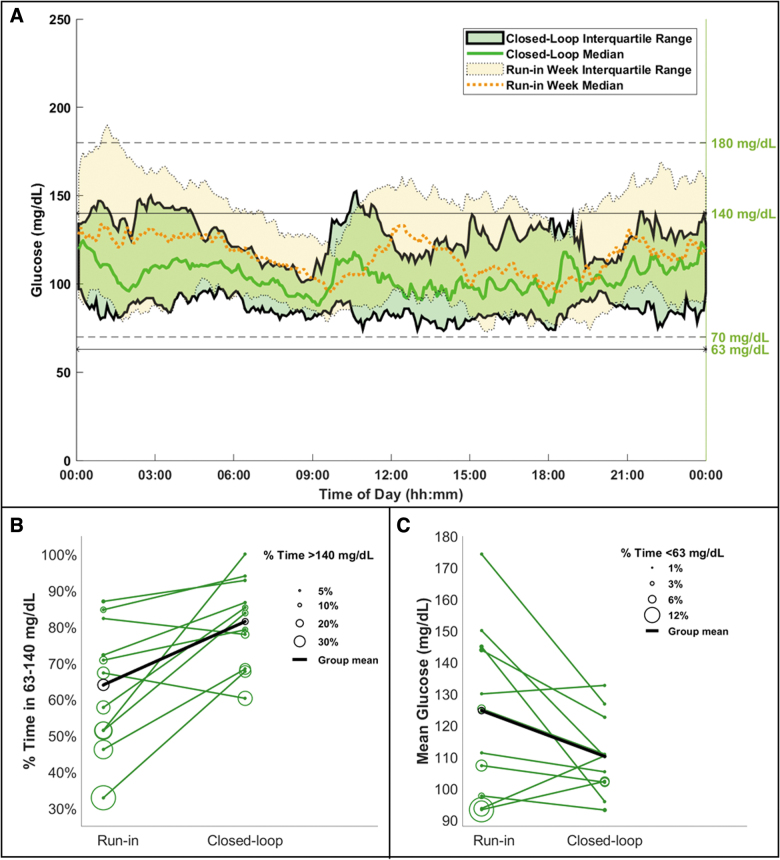
(A) Comparison of CGM glucose levels between CLC therapy (solid traces and green area) and participants' standard therapy (dashed traces and yellow area), (B) individual breakdown of time spent in the target range on the y-axis and time spent above the target range is represented by circles, (C) individual breakdown of mean CGM glucose on the y-axis and time spent below the target range is represented by circles. CGM, continuous glucose monitor; CLC, closed-loop control.

