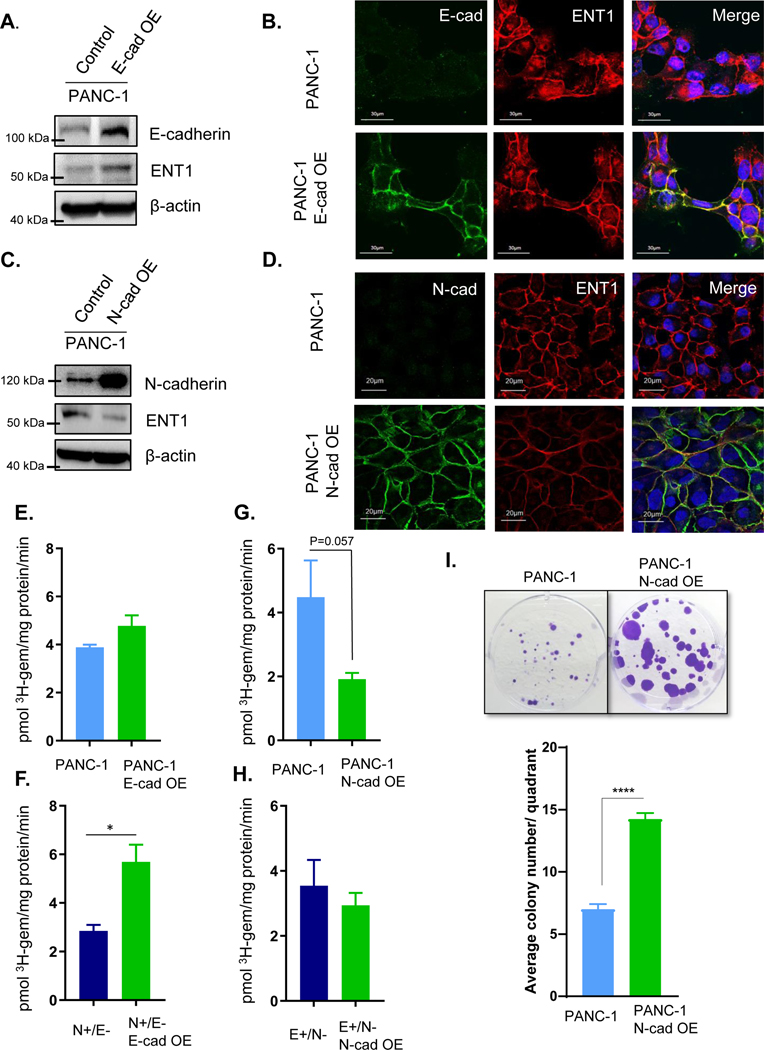
Figure 2: Cadherin switching diminishes ENT1 cell surface localization and function.
A. Western blot analysis shows overexpression (OE) of E-cadherin in PANC-1 cells and ENT1 protein levels. β-actin is used as an internal control B. Immunostaining for E-cadherin is shown in green (left), hENT1 in red (middle), and both channels merged with DAPI (right). Original magnification, x60 C. ENT1 protein levels were examined by Western blotting in control and PANC-1 N-cadherin OE cells; OE= overexpression. β-actin is used as an internal control D. Confocal micrographs display co-immunostaining for N-cadherin in green, ENT1 in red, and merged with nuclear counterstain DAPI E.-H. Transport of 3H-gemcitabine (1 μM) in sodium containing buffer for each cell type measured for 1 minute. Bars, means ± SD (n=3). Statistical analyses were performed with two-tailed Student’s t-test. I. Colony formation ability of PANC-1 and PANC-1 cells overexpressing N-cadherin was performed by seeding equivalent cell number and treating with 10 nM gemcitabine for 3 weeks prior to staining with crystal violet to visualize colonies. Quantification was performed by counting the number of colonies ≥1 mm in size for each quadrant of the 6-well plate and averaging for the entire well. Bars= mean ± SEM. Statistical analyses were performed with two-tailed Student’s t-test. *P ≤ 0.05, ****P ≤ 0.0001

