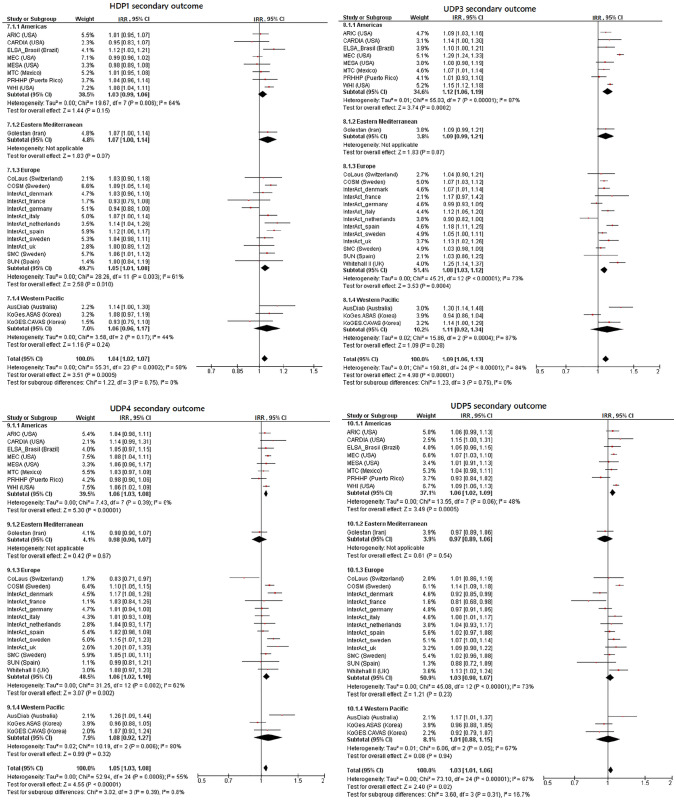
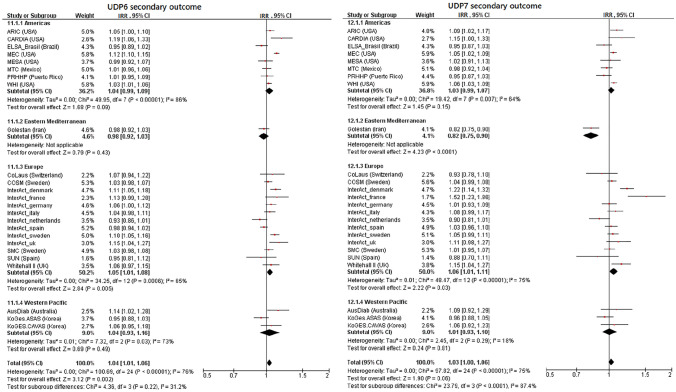
Fig. 2.
Incidence rate ratios and 95% confidence intervals for the association between replicated dietary pattern variables and incident type 2 diabetes. Shown are results for the secondary outcome definition and harmonized food groups with published factor loadings > 0.2 by subgroups of region. Associations are adjusted for age, sex, BMI, physical activity, education, smoking, alcohol consumption, total energy intake and hypertension. CI confidence intervals, IRR incidence rate ratios, HDP healthy dietary pattern, UDP unhealthy dietary patterns


