Fig. 1.

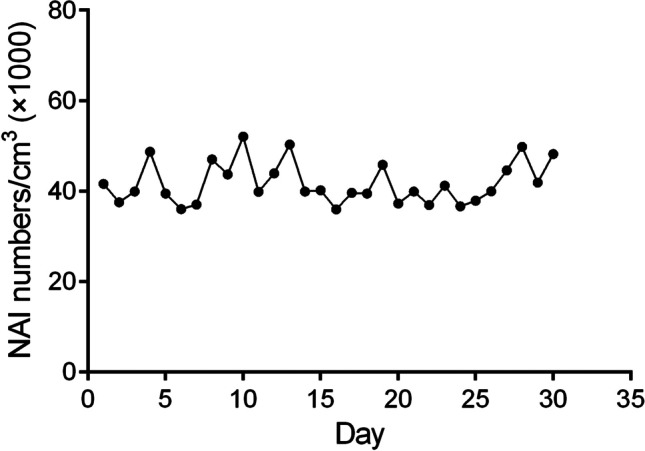
The concentration of negative air ions detected daily. Six air samples per minute to detect the concentration, removes the maximum and minimum values, and average value of the remaining 4 times are shown by NAI numbers/cm3 in Y axis

The concentration of negative air ions detected daily. Six air samples per minute to detect the concentration, removes the maximum and minimum values, and average value of the remaining 4 times are shown by NAI numbers/cm3 in Y axis