Fig. 2.
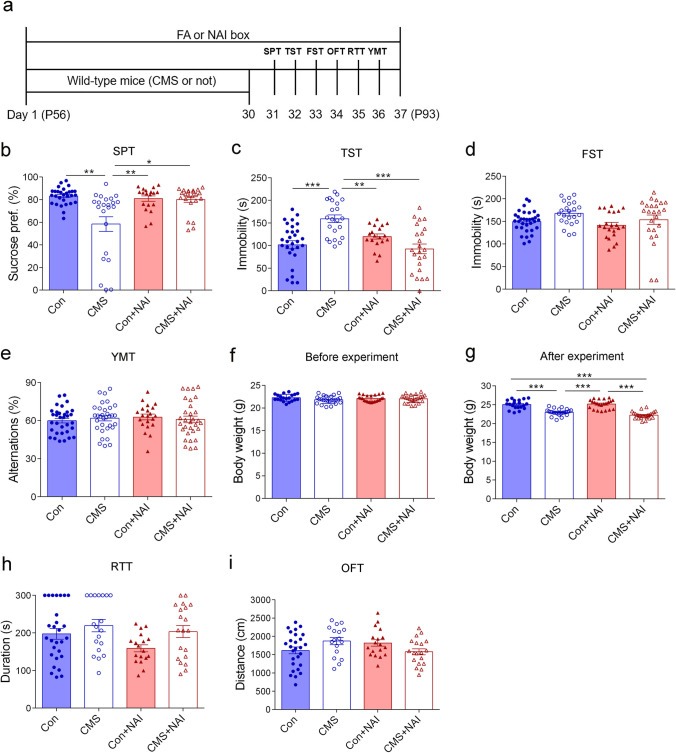
NAI intervention alleviates depression-like behavior in mice after stress exposure. a Diagram of experiment design and timeline. b Sucrose preference in the Sucrose preference (SPT). The one-way ANOVA test measured the significant differences between these groups {F[3,92] = 11.247, ***P < 0.0001; Tamhane’s T2 multiple comparisons test showed **P = 0.003 (Con vs. CMS); *P = 0.012 (CMS vs. CMS + NAI); **P = 0.009 (CMS vs. Con + NAI)}. c Time spent immobile in the tail suspension test (TST). The one-way ANOVA test measured the significant differences between these groups {F[3,90] = 10.431, ***P < 0.0001; Tamhane’s T2 multiple comparisons test showed ***P < 0.0001 (Con vs. CMS); **P = 0.003 (CMS vs. Con + NAI); ***P < 0.0001 (CMS vs. CMS + NAI)}. d Time spent immobile in the forced swimming test (FST). The one-way ANOVA test with Tamhane’s T2 multiple comparisons test measured the significant differences between these groups {F[3,98] = 2.475, P = 0.066}. e Spontaneous alternation in Y maze test (YMT). The one-way ANOVA test with Bonferroni multiple comparisons test measured the significant differences between these groups {F[3,122] = 0.366, P = 0.778}. f Body weight evaluated before the experiment. The one-way ANOVA test with Bonferroni multiple comparisons test measured the significant differences between these groups {F[3,87] = 2.509, P = 0.064}. g Body weight evaluated after 30-day CMS treatment in mice with or without NAI exposure. The one-way ANOVA test measured the significant differences between these groups {F[3,87] = 45.286, ***P < 0.0001; Bonferroni multiple comparisons test showed ***P < 0.0001 (Con vs. CMS); ***P < 0.0001 (Con vs. CMS + NAI); ***P < 0.0001 (CMS vs. Con + NAI); ***P < 0.0001 (CMS + NAI vs. Con + NAI)}. h Time spent on the rod in the rotarod test (RTT). The one-way ANOVA test with Tamhane’s T2 multiple comparisons test measured the significant differences between these groups {F[3,81] = 2.681, P = 0.052}. i Distance traveled in the open field test (OFT). The one-way ANOVA test with Bonferroni multiple comparisons test measured the significant differences between these groups {F[3,77] = 2.338, P = 0.08}. *P < 0.05, **P < 0.01, ***P < 0.001. Data are presented as mean ± S.E.M

