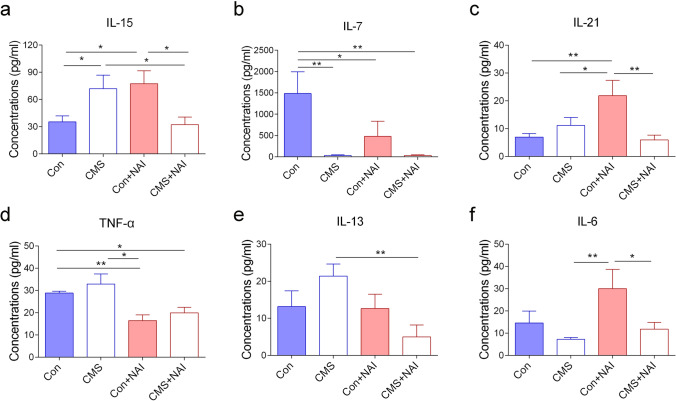
Fig. 4.
Effects of NAI intervention on inflammatory cytokine levels in serum of mice with CMS. a The concentration of IL-15. The one-way ANOVA test measured the significant differences between these groups {F[3,35] = 4.055, *P = 0.014; Bonferroni multiple comparisons test showed *P = 0.033 (CMS vs. Con); *P = 0.015 (Con + NAI vs. Con); *P = 0.024 (CMS vs. CMS + NAI); *P = 0.011 (CMS + NAI vs. Con + NAI)}. b The concentration of IL-7. The one-way ANOVA test measured the significant differences between these groups {F[3,34] = 4.485, **P = 0.009; Bonferroni multiple comparisons test showed P = **0.003 (CMS vs. Con); **P = 0.003 (CMS + NAI vs. Con); *P = 0.032 (Con vs. Con + NAI)}. c The concentration of IL-21. The one-way ANOVA test measured the significant differences between these groups {F[3,35] = 4.703, P = **0.007; Bonferroni multiple comparisons test showed **P = 0.004 (Con vs. Con + NAI); *P = 0.029 (CMS vs. Con + NAI); **P = 0.002 (CMS + NAI vs. Con + NAI)}. d The concentration of TNF-α. The one-way ANOVA test measured the significant differences between these groups {F[3,35] = 6.485, **P = 0.001; Tamhane’s T2 multiple comparisons test showed *P = 0.033 (CMS + NAI vs. Con); **P = 0.005 (Con vs. Con + NAI); *P = 0.044 (CMS vs. Con + NAI)}. e The concentration of IL-13. The one-way ANOVA test measured the significant differences between these groups {F[3,34] = 3.328, *P = 0.031; Bonferroni multiple comparisons test showed **P = 0.003 (CMS vs. CMS + NAI)}. f The concentration of IL-6. The one-way ANOVA test measured the significant differences between these groups {F[3,33] = 3.304, *P = 0.032; Bonferroni multiple comparisons test showed **P = 0.006 (CMS vs. Con + NAI); *P = 0.025 (CMS + NAI vs. Con + NAI)}. (*P < 0.05, **P < 0.01). 9 ≤ n ≤ 11/group

