Fig. 1.
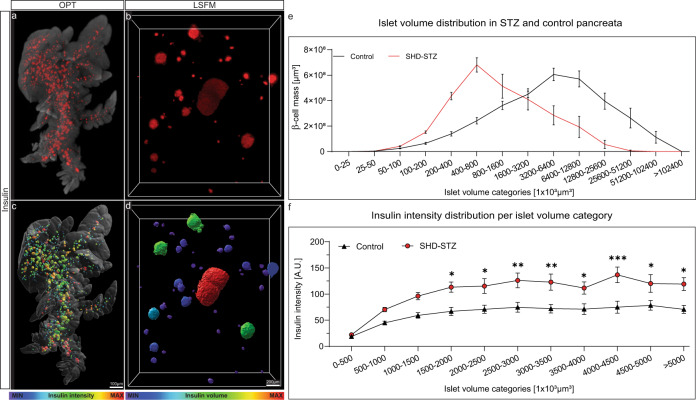
Examples of OPT and LSFM based data visualization and quantification. The datasets included in this data descriptor can be used for a multitude of assessments pertinent to STZ-induced diabetes in mice. This includes a range of quantitative and 3D-spatial analyses (volumes, signal intensities, numbers, shapes, distribution patterns, etc.) of insulin and GLUT2 stained islets of Langerhans subject to different modes of STZ administration and at different time points. (a,b) Images of maximum intensity projections based on pancreatic volumes from control C57BL/6 mice showing the distribution of insulin labelled islets of Langerhans (red) in the pancreatic splenic lobe imaged by OPT (a) and high-resolution LSFM image (b). (c,d) The same specimen as in (a,b) in which the intensity of the signal intensity has been colour coded. Blue colour corresponds to low and red to high signal intensity, respectively. (e) Graph illustrating the possibility to study statistically assess spatial distribution patterns subject to STZ treatment. (f) Graph illustrating the possibility to statistically assess staining intensities of islets of different size categories subject to STZ administration. Data in (e,f) is based on pancreata 2 weeks post SHD administration). Scale bar in (c,d) corresponds to 1 mm and 200 µm in (a,b) respectively. Data is presented as averages and error bars represent SEM. Significance in graph (f) was tested using a One-way ANOVA. * represents P ≤ 0.05, ** represents P ≤ 0.01 and *** represents P ≤ 0.001.

