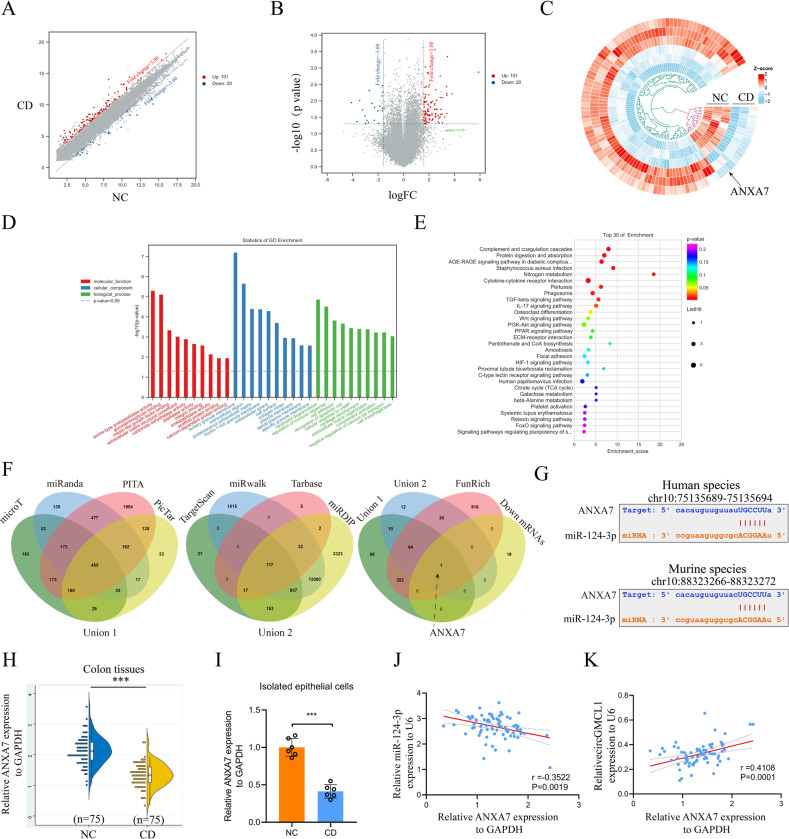
Fig. 3. ANXA7 was identified as one target gene of miR-124-3p.
Scatter plots (A), volcano plots (B), and heatmap (C) showing mRNA expression profile of colon tissues from CD patients and NCs (threshold: FC > 3, P < 0.05). The histogram (D) and bubble (E) displaying results of Go enrichment analyses, including BP, MF, and CC for the dysregulated mRNAs. Relative circGMCL1 expression in colon tissues from CD patients and NCs as determined by qRT-PCR analysis. F Venn diagram displaying the overlapping miR-124-3p target predicting algorithms and up-regulated mRNAs. G The predicted binding sites between miR-124-3p and ANXA7 in human and mouse species based on starbase database. Relative ANXA7 expression in colon tissues H and isolated epithelial cells I of CD patients and NCs as determined using qRT-PCR assay. The linear correlation between relative ANXA7 expression and miR-124-3p J, circGMCL1 K in CD patients (n = 75) as evaluated by qRT-PCR analysis. ANXA7 annexin 7, CD Crohn’s disease, NC normal control, FC fold change, GO gene ontology, BP biological processes, MF molecular function, CC cellular component, qRT-PCR quantitative real time-polymerase chain reaction. Data are presented as mean ± SD. ***P < 0.001 by Student’s t tests.

