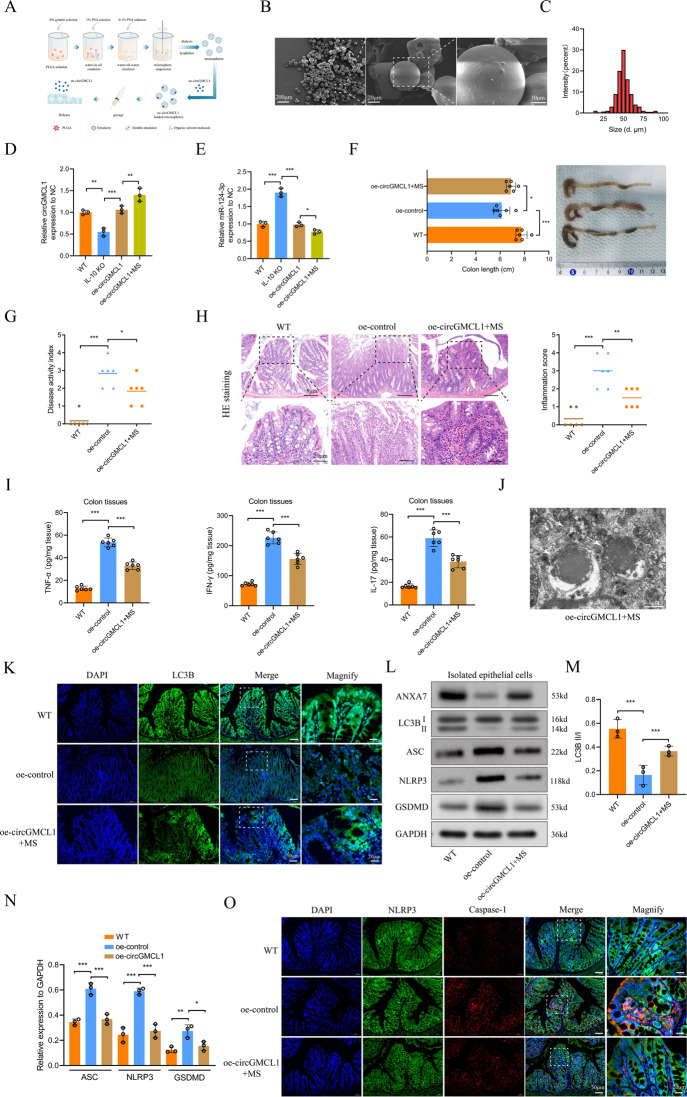
Fig. 6. In vivo effects of circGMCL1 in IL-10 KO mice against colitis.
A Preparation of PLGA MSs and the oe-circGMCL1 administration scheme. B Morphologies of PLGA MSs as observed under SEM. C Diameter distributions of MSs. Relative circGMCL1 D and miR-124-3p E expression in colon tissues treated with oe-circGMCL1. Colon length (F), DAI (G), pathological inflammatory infiltration H, proinflammatory cytokines (TNF-α, IFN-γ, and IL-17) in colon tissues I of IL-10 KO mice subjected to PLGA MS-carried oe-circGMCL1 treatment. J Representative TEM image of autophagosome in oe-circGMCL1-treated IL-10KO mice. K Immunofluorescence of LC3B in colon tissues. L Protein levels of ANXA7, LC3B, NLRP3, ASC, and GSDMD in isolated epithelial cells as quantified by western blotting. LC3B II/I ratio (M) and quantitative analysis of protein expression (N) by western blotting. (O) Immunofluorescence of NLRP3 and caspase-1 in colon tissues. PLGA poly(lactic-co-glycolic acid), MSs microspheres, qRT-PCR quantitative real time-polymerase chain reaction, SEM scanning electron microscope, TEM transmission electron microscope, DAI disease activity index, IL interleukin, IL-10 KO IL-10 knock-out, HE hematoxylin and eosin, TNF-α tumor necrosis factor-α, IFN-γ interferon-γ, ANXA7 annexin 7. Data are expressed as mean ± SD. *P < 0.05, **P < 0.01, ***P < 0.001 by one-way ANOVA test.

