Fig. 2 –
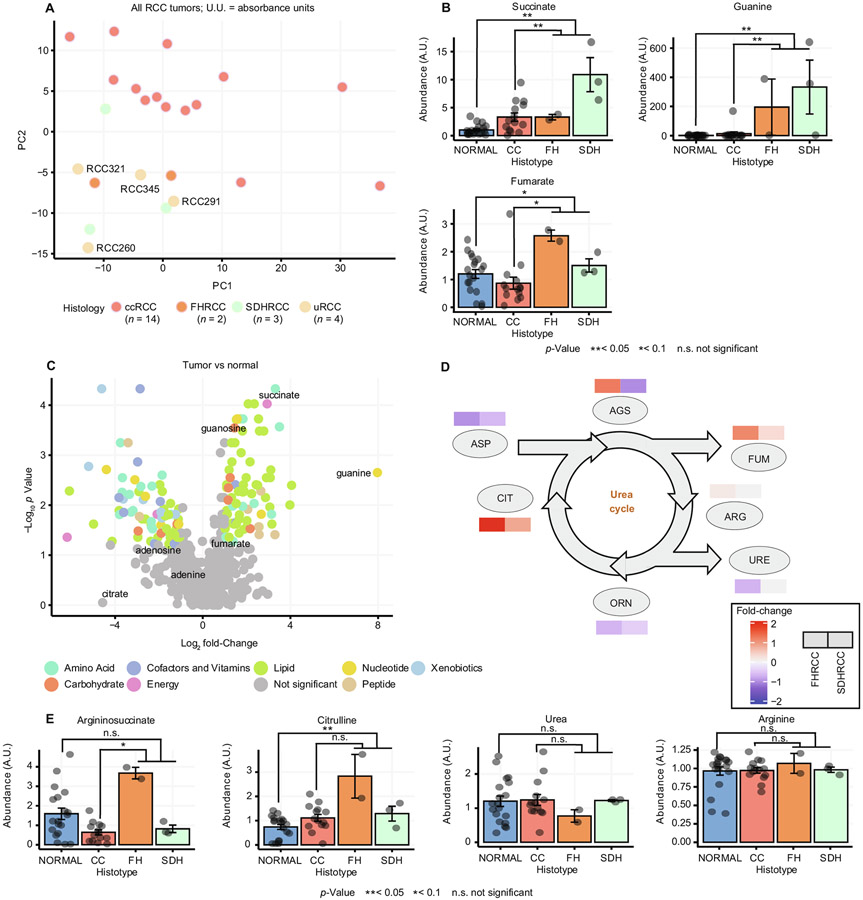
Metabolomic analysis and comparison of FHRCC and SDHRCC. (A) Principal component analysis plot of ccRCC (n = 14), unclassified RCC (n = 4), SDHRCC (n = 3), and FHRCC tumors (n = 2). The unclassified RCC tumors as well as the SDHRCC and FHRCC tumors cluster away from the ccRCC tumors. (B) Barplot showing levels of succinate, fumarate, and guanine in normal kidney tissue and ccRCC, FHRCC, and SDHRCC tumors. (C) Volcano plot of metabolites that were elevated in SDHRCC/FHRCC tumors compared to normal tissue, including succinate and guanine. (D) Urea cycle metabolites (argininosuccinate and citrulline) are more elevated in FHRCC than in SDHRCC when compared to normal tissue. (E) Barplot showing levels of argininosuccinate, urea, citrulline, and arginine in normal kidney tissue and ccRCC, FHRCC, and SDHRCC tumors. Argininosuccinate and citrulline were uniquely elevated in FHRCC, but urea and arginine were not. RCC = renal cell carcinoma; FHRCC = FH-deficient RCC; SDHRCC = SDH-deficient RCC; ccRCC = clear-cell RCC; PC1 = principal component 1; PC2 = principal component 2; A.U. = absorbance unit; AGS = argininosuccinate; FUM = fumarate; ARG = arginine; URE = urea; ORN = ornithine; CIT = citrulline; ASP = aspartate.

