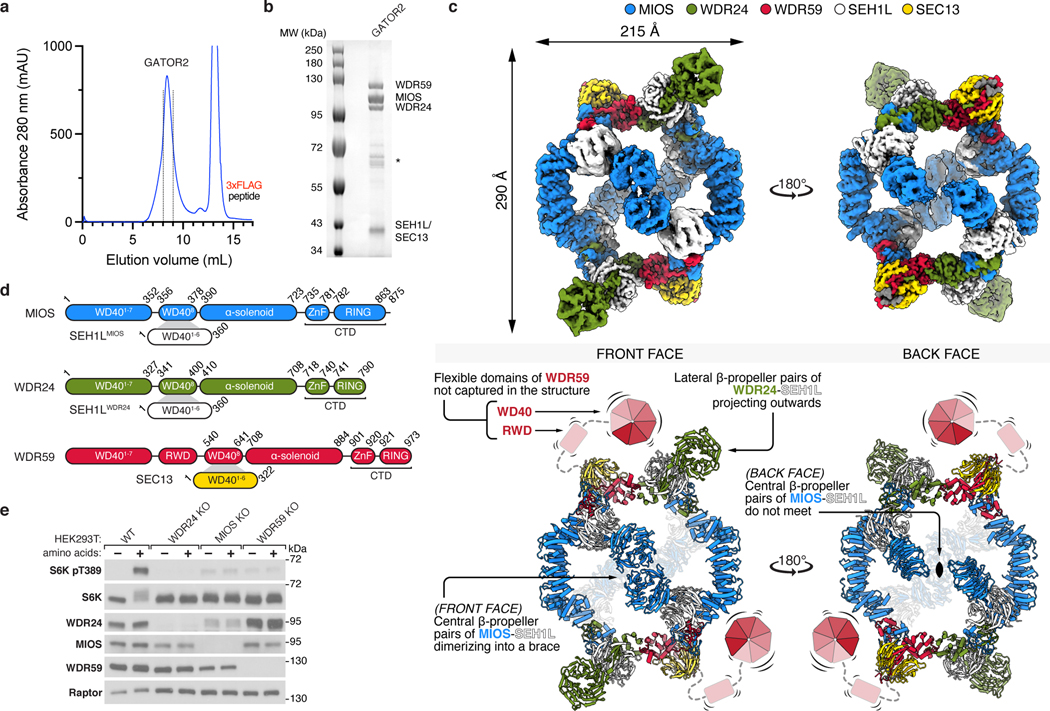
Figure 1: Structure of human GATOR2.
(a) Size-exclusion chromatography profile of human GATOR2 used for structural analyses. mAU, milli-absorbance unit.
(b) Coomassie Blue stained SDS-PAGE analysis of purified GATOR2. Asterisk indicates the CCT chaperonin complex that co-purifies with GATOR2.
(c) Cryo-EM structure of the human GATOR2 complex. Two views of the experimental map (top) are shown next to the corresponding views of the molecular model (bottom). The C2 symmetry axis is perpendicular to the viewing plane, and marked with a filled ellipse.
(d) Domain organization of GATOR2 components. Numbers denote the boundaries of the indicated domains. Gray trapezoids indicate β-blade donation by WDR24, MIOS, or WDR59 to complete β-propellers of SEH1L or SEC13.
(e) Loss of core GATOR2 components renders mTORC1 signaling insensitive to amino acid availability. HEK293T cell clones of the indicated genotype were starved for amino acids for 60 min and restimulated with amino acids for 15 min prior to harvest. Cell lysates were analyzed by immunoblotting for the levels and phosphorylation states of the indicated proteins.
Data in (e) are representative of two independent experiments. For gel source data, see Supplementary Figure 1.

