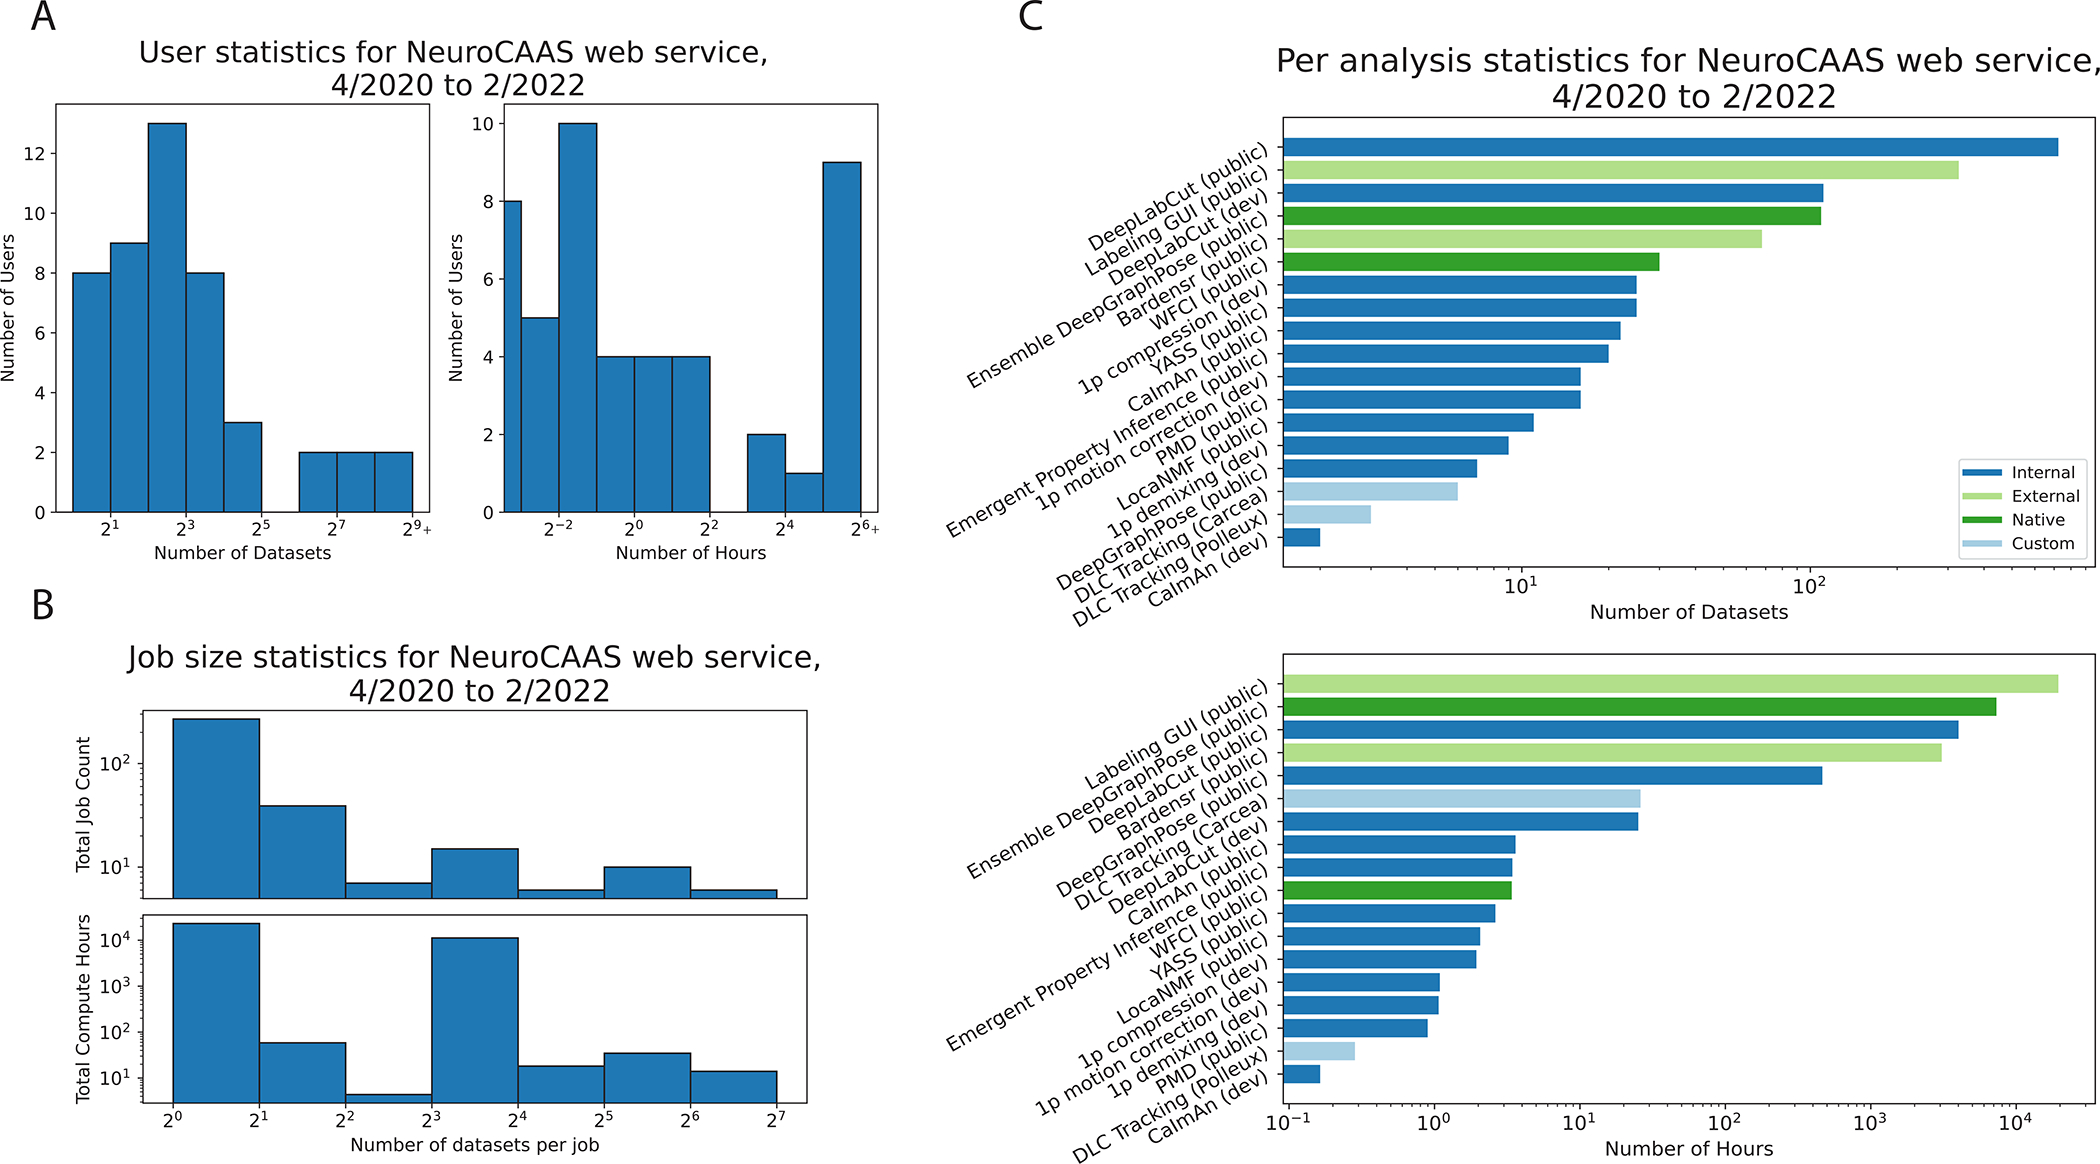
Figure 3: Usage statistics NeuroCAAS Platform.

Usage data over a 22-month alpha test period. A. Histogram for number of datasets (left) and corresponding compute hours (right) spent by each active user of NeuroCAAS. B. Histograms for job size indicates the number of datasets (top) and corresponding compute hours (bottom) concurrently analyzed in jobs. C. Usage grouped by platform developer. Dark blue: analyses adapted for NeuroCAAS by paper authors. Light green: analyses that were not developed by NeuroCAAS authors. Dark green: NeuroCAAS native analyses (§2.4, 2.5). Light blue: custom versions of generic analyses built for individual alpha users. We exclude usage attributed to NeuroCAAS team members.
