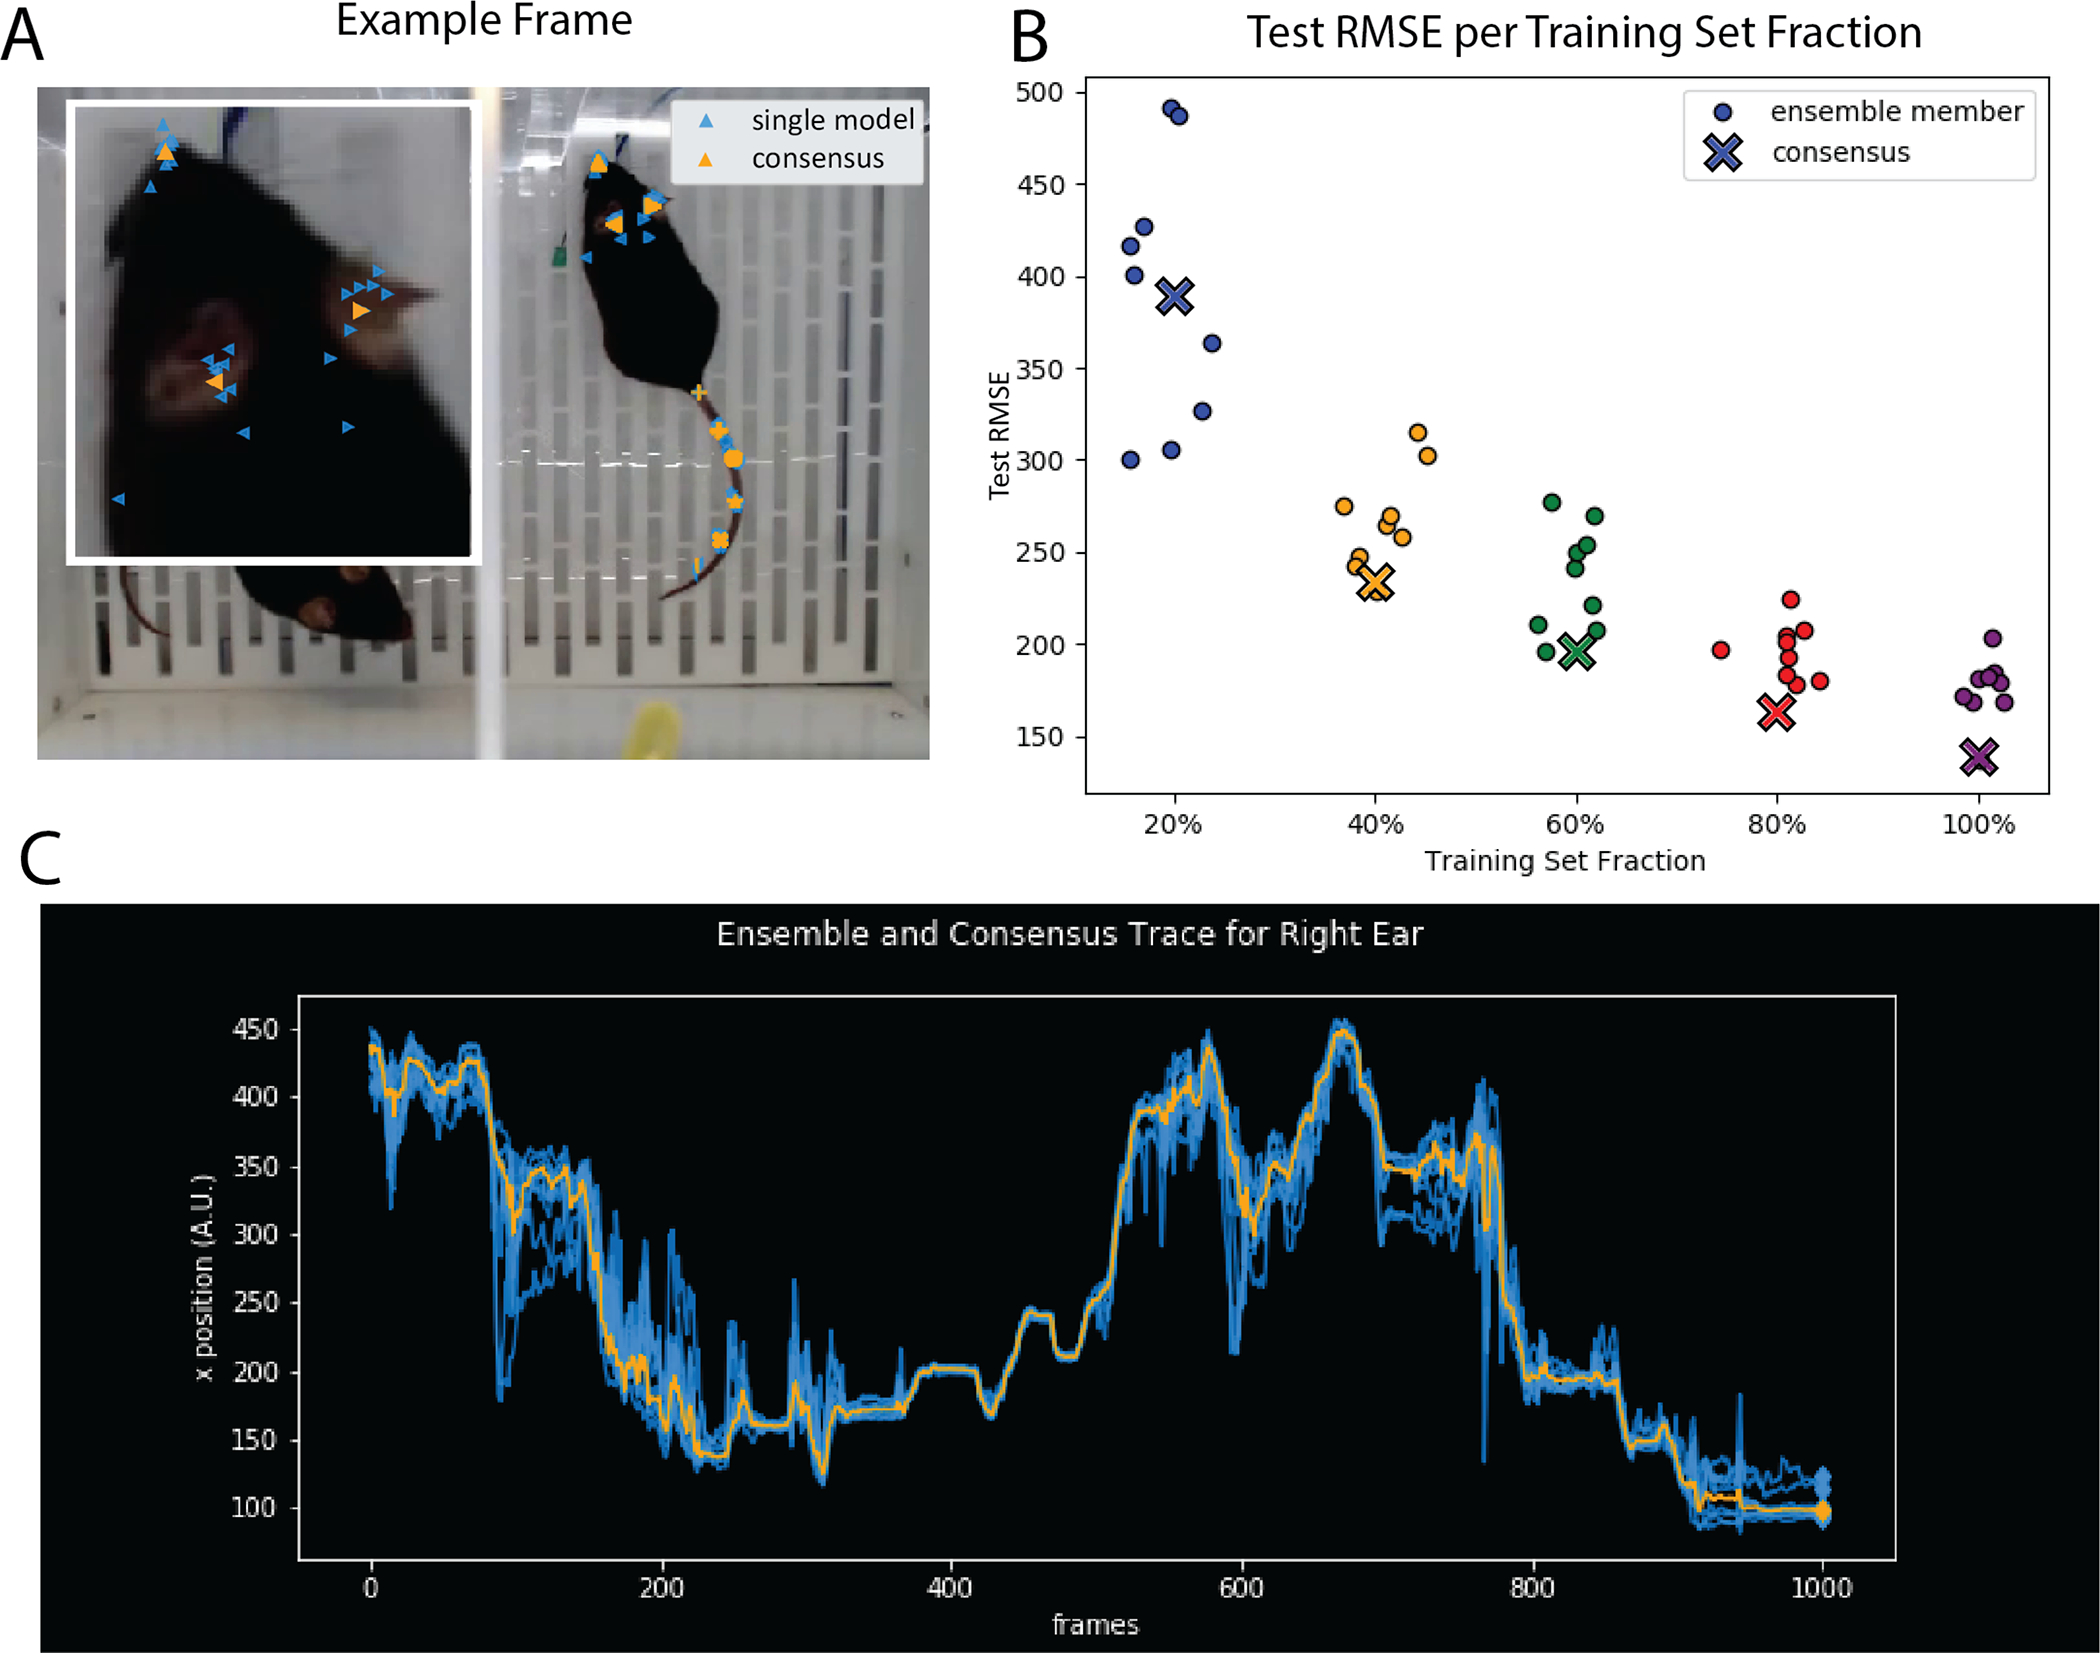
Figure 6: Ensemble Markerless Tracking.

A. Example frame from mouse behavior dataset (courtesy of Erica Rodriguez and C. Daniel Salzman) tracking keypoints on the top down view of a mouse, as analyzed in Wu et al. (2020). Marker shapes track different body parts: blue markers representing the output of individual tracking models, and orange markers representing the consensus. Inset image shows tracking performance on the nose and ears of the mouse. B. consensus test performance vs. test performance of individual networks on a dataset with ground truth labels as measured via root mean squared error (RMSE). C. traces from 9 networks (blue) + consensus (orange). Across the entire figure, ensemble size = 9. A and C correspond to traces taken from the 100% split in B corresponding to 20 training frames.
