Fig. 2.

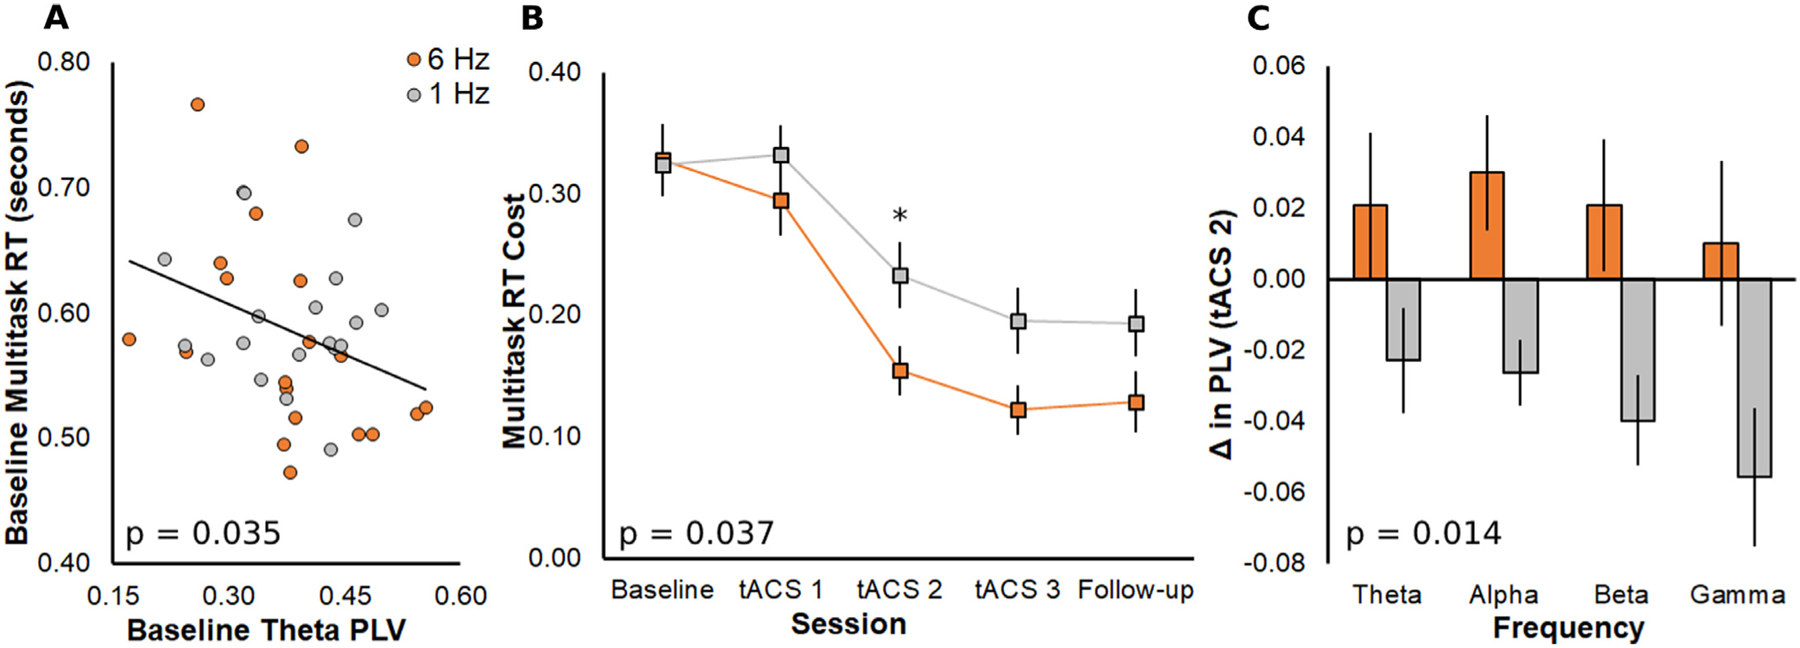
A) Data included in stepwise regression model across all participants on the dependent variable of baseline multitasking RT with the significant predictor of baseline theta PLV. P value generated from significant stepwise model. The black trendline represents both groups and participants are color-coded for the tACS treatment that they will later receive (orange, 6 Hz; gray, 1 Hz). B) Cost of multitasking compared to single task on RT at each session. The group that received 6 Hz tACS had faster and overall greater gains than the group that received 1 Hz tACS. P value generated from time × group interaction. Follow-up analyses revealed a significant group difference in RT cost change on tACS 2 (denoted by small asterisk). C) Group change in each PLV frequency band on tACS 2. Theta tACS increased PLV and control tACS decreased PLV. P value generated from main effect of tACS group.
