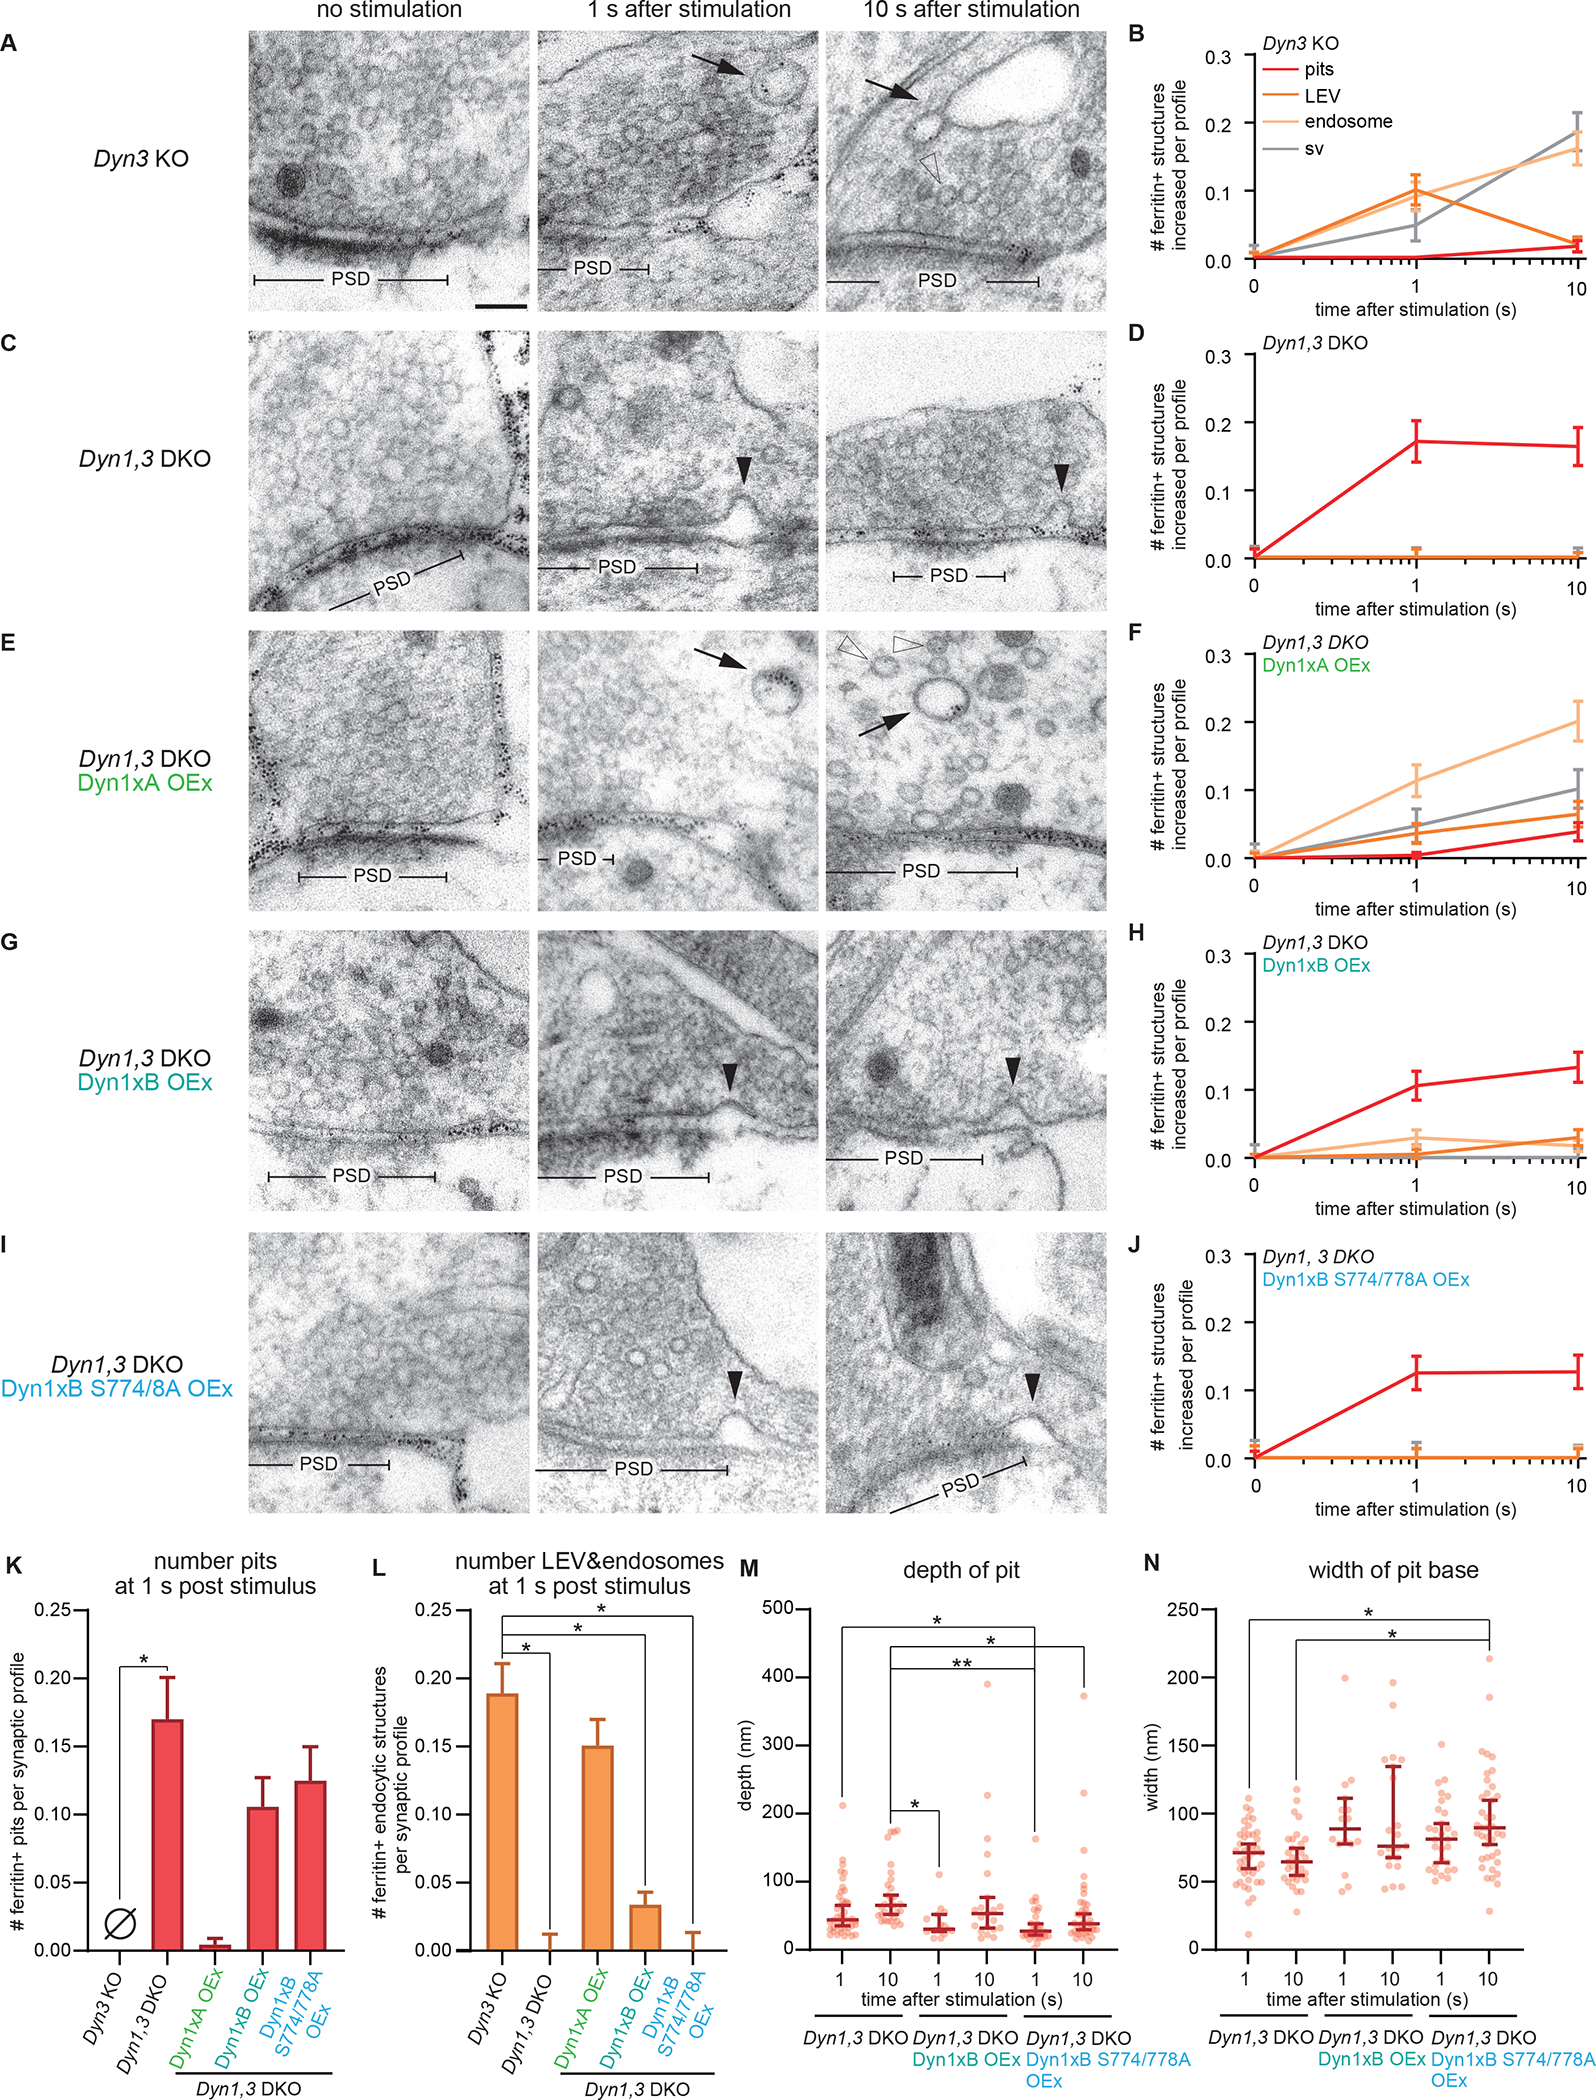
Figure 1. Dyn1xA splice variant, but not xB variant, mediates ultrafast endocytosis.

(A, C, E, G and I) Example micrographs showing endocytic pits and ferritin-containing endocytic structures at the indicated time points in Dyn3 KO (A), Dyn1, 3 DKO (C), Dyn1, 3 DKO, Dyn1xA overexpression (OEx) (E), Dyn1, 3 DKO, Dyn1xB OEx (G), Dyn1, 3 DKO, Dyn1xB S774/778A OEx (I). Black arrowheads, endocytic pits; black arrows, large endocytic vesicles (LEVs) or endosomes; white arrowheads, synaptic vesicles. Scale bar: 100 nm. PSD, post-synaptic density.
(B, D, F, H, and J) Plots showing the increase in the number of each endocytic structure per synaptic profile after a single stimulus in neurons with indicated genotypes.
(K) Number of endocytic pits at 1s after stimulation. The numbers are re-plotted from the 1 s time point in (B, D, F, H, and J).
(L) Number of LEVs and endosomes at 1s after stimulation. The numbers of LEVs and endosomes are summed from the data in (B, D, F, H, and J) and averaged.
(M and N) Plots showing the width (M) and depth (N) of endocytic pits at the 1s time point.
*p < 0.05, **p < 0.0001. See Data S1 for the n values, statistical test, and detailed numbers for each time point.
