
Figure 3. Dyn1xA exhibits liquid-like behaviors in vitro and in COS-7 cells.
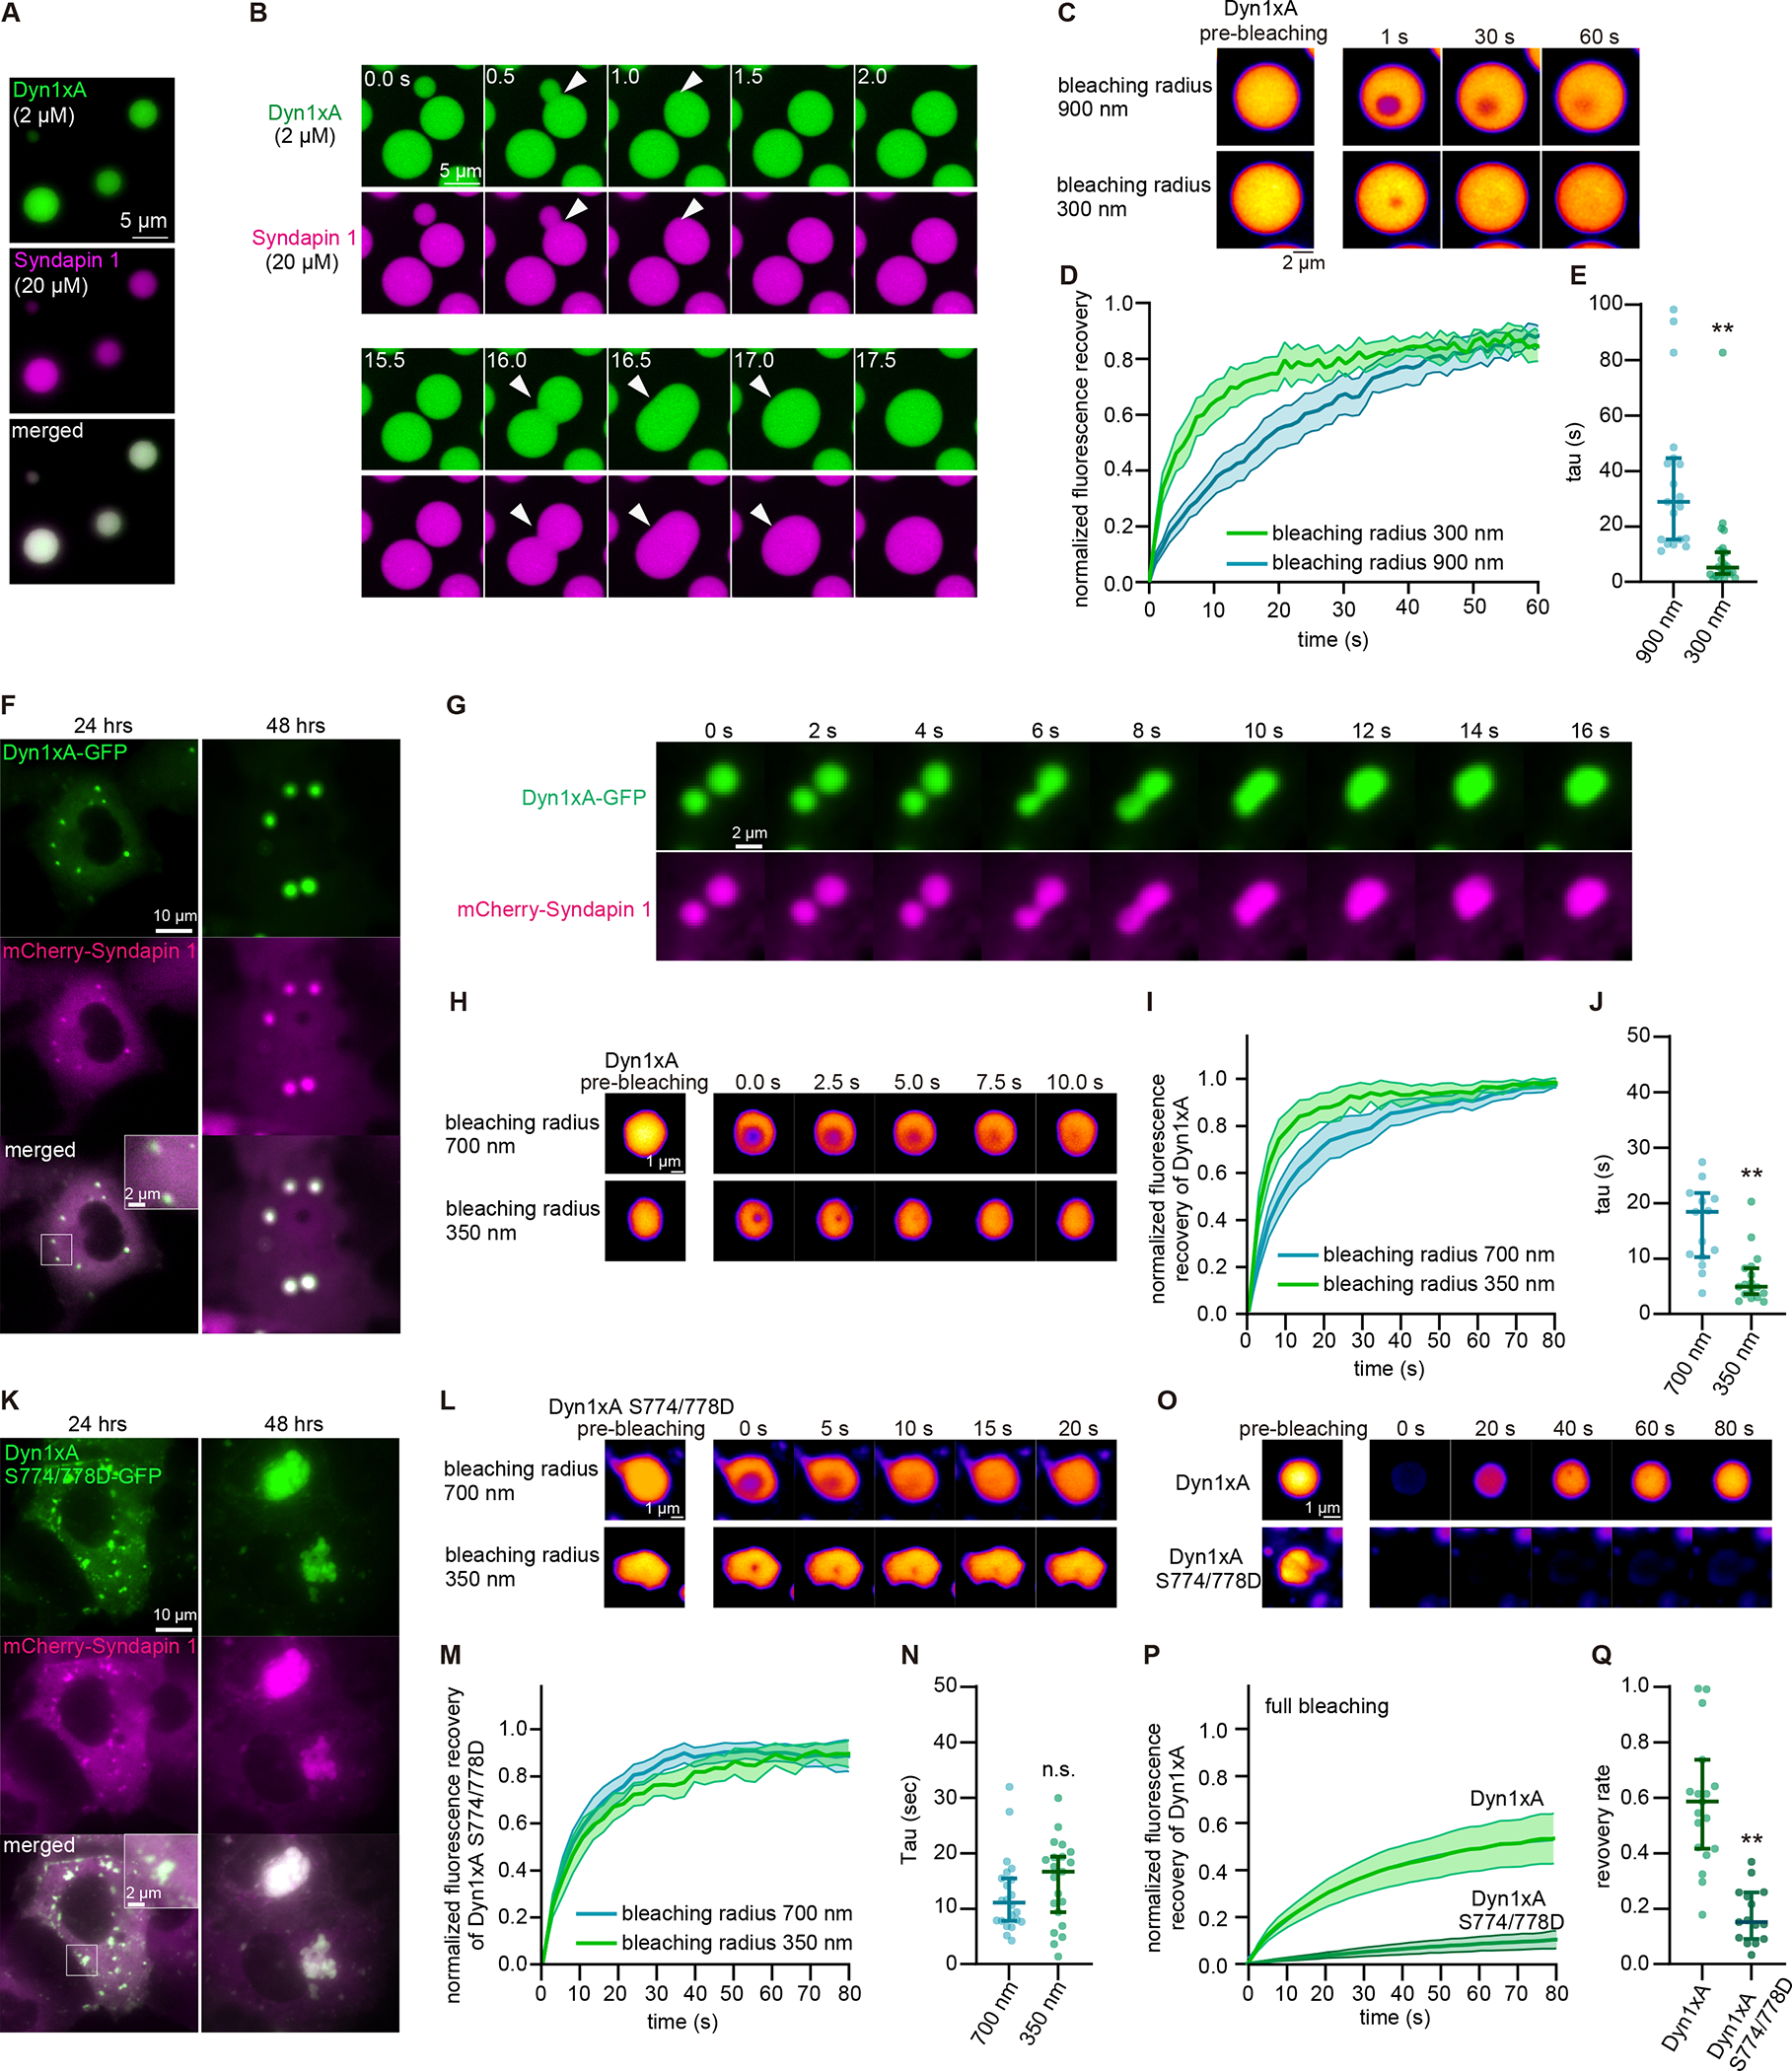
(A) Example images of purified Dyn1xA (labeled with Alexa488) and Syndapin1 (labeled with Alexa 549) forming droplets under the physiological salt concentration and with 5 % PEG.
(B) Example time-lapse images of Dyn1xA and Syndapin1 droplets undergoing fusion.
(C) Example time-lapse images of FRAP experiments in in vitro. Dyn1xA and Syndapin1 droplets were photobleached at 480 nm using the region-of-interest (ROI) radius of 900 nm or 300 nm.
(D) Normalized fluorescence recovery of Dyn1xA signals in the indicated ROI sizes. Fluorescence signals were normalized between immediately (0 s) and 60 s after the photobleaching.
(E) The recovery time constant of Dyn1xA signals following the photobleaching using the indicated ROI sizes. Each dot represents a Dyn1xA-Syndapin 1 droplet. The kinetics of fluorescence recovery after photobleaching is dependent on the radius of photobleaching (Figure 3C–E & S5K), suggesting that the molecular rearrangement is dominated by protein diffusion rather than binding and unbinding.
(F) Example images of COS-7 cells expressing Dyn1xA-GFP and mCherry-Syndapin1 at 24 hours and 48 hours after the transfection.
(G) Example time-lapse images showing fusion of Dyn1xA-GFP and mCherry-Syndapin1 droplets.
(H) Examples time-lapse images of FRAP experiments on Dyn1xA-GFP and mCherry-Syndapin1 droplets. Time indicates after the photobleaching. Dyn1xA signals were photobleached at 480 nm using the ROI radius of 700 nm or 350 nm ROI.
(I) Normalized fluorescence recovery of Dyn1xA signals in the indicated ROI sizes.
(J) The recovery time constant of Dyn1xA signals following the photobleaching using the indicated ROI sizes in (I).
(K) Example images of COS-7 cells expressing Dyn1xA S774/778D-GFP (which inhibits Syndapin1 binding) and mCherry-Syndapin1 at 24 hours and 48 hours after the transfection.
(L) Examples time-lapse images of FRAP experiments on Dyn1xA S774/778D-GFP and mCherry-Syndapin1 droplets. Dyn1xA signals were photobleached at 480 nm using the ROI radius of 700 nm or 350 nm.
(M) Normalized fluorescence recovery of Dyn1xA signals in the indicated ROI sizes.
(N) The recovery time constant of Dyn1xA S774/778D-GFP signals following the photobleaching using the indicated ROI sizes in (M). The recovery kinetics between two different ROI sizes are similar, indicating that the recovery is mediated by binding and unbinding of molecules rather than diffusion of proteins.
(O) Examples time-lapse images of FRAP experiments on Dyn1xA and mCherry-Syndapin1 droplets or Dyn1xA S774/778D-GFP and mCherry-Syndapin1 droplets with the photobleaching laser on the entire droplets. Dyn1xA or Dyn1xA S774/778D-GFP signals were photobleached with 480-nm laser.
(P) Normalized fluorescence recovery of Dyn1xA or Dyn1xA S774/778D-GFP signals.
(Q) The recovery rate of Dyn1xA or Dyn1xA S774/778D-GFP signals at 80 s after the photobleaching in (P), indicating that Dyn1xA S774/778D-GFP molecules form aggregates.
In (I, M, P, Q), fluorescence signals were normalized between immediately (0 s) and 80 s after the photobleaching. Times above FRAP time-lapse images indicate after the photobleaching.
All data are examined by n > 15 droplets from two independent protein preparations or cultures. **p < 0.0001. See Data S1 for the n values, statistical test, and detailed numbers.