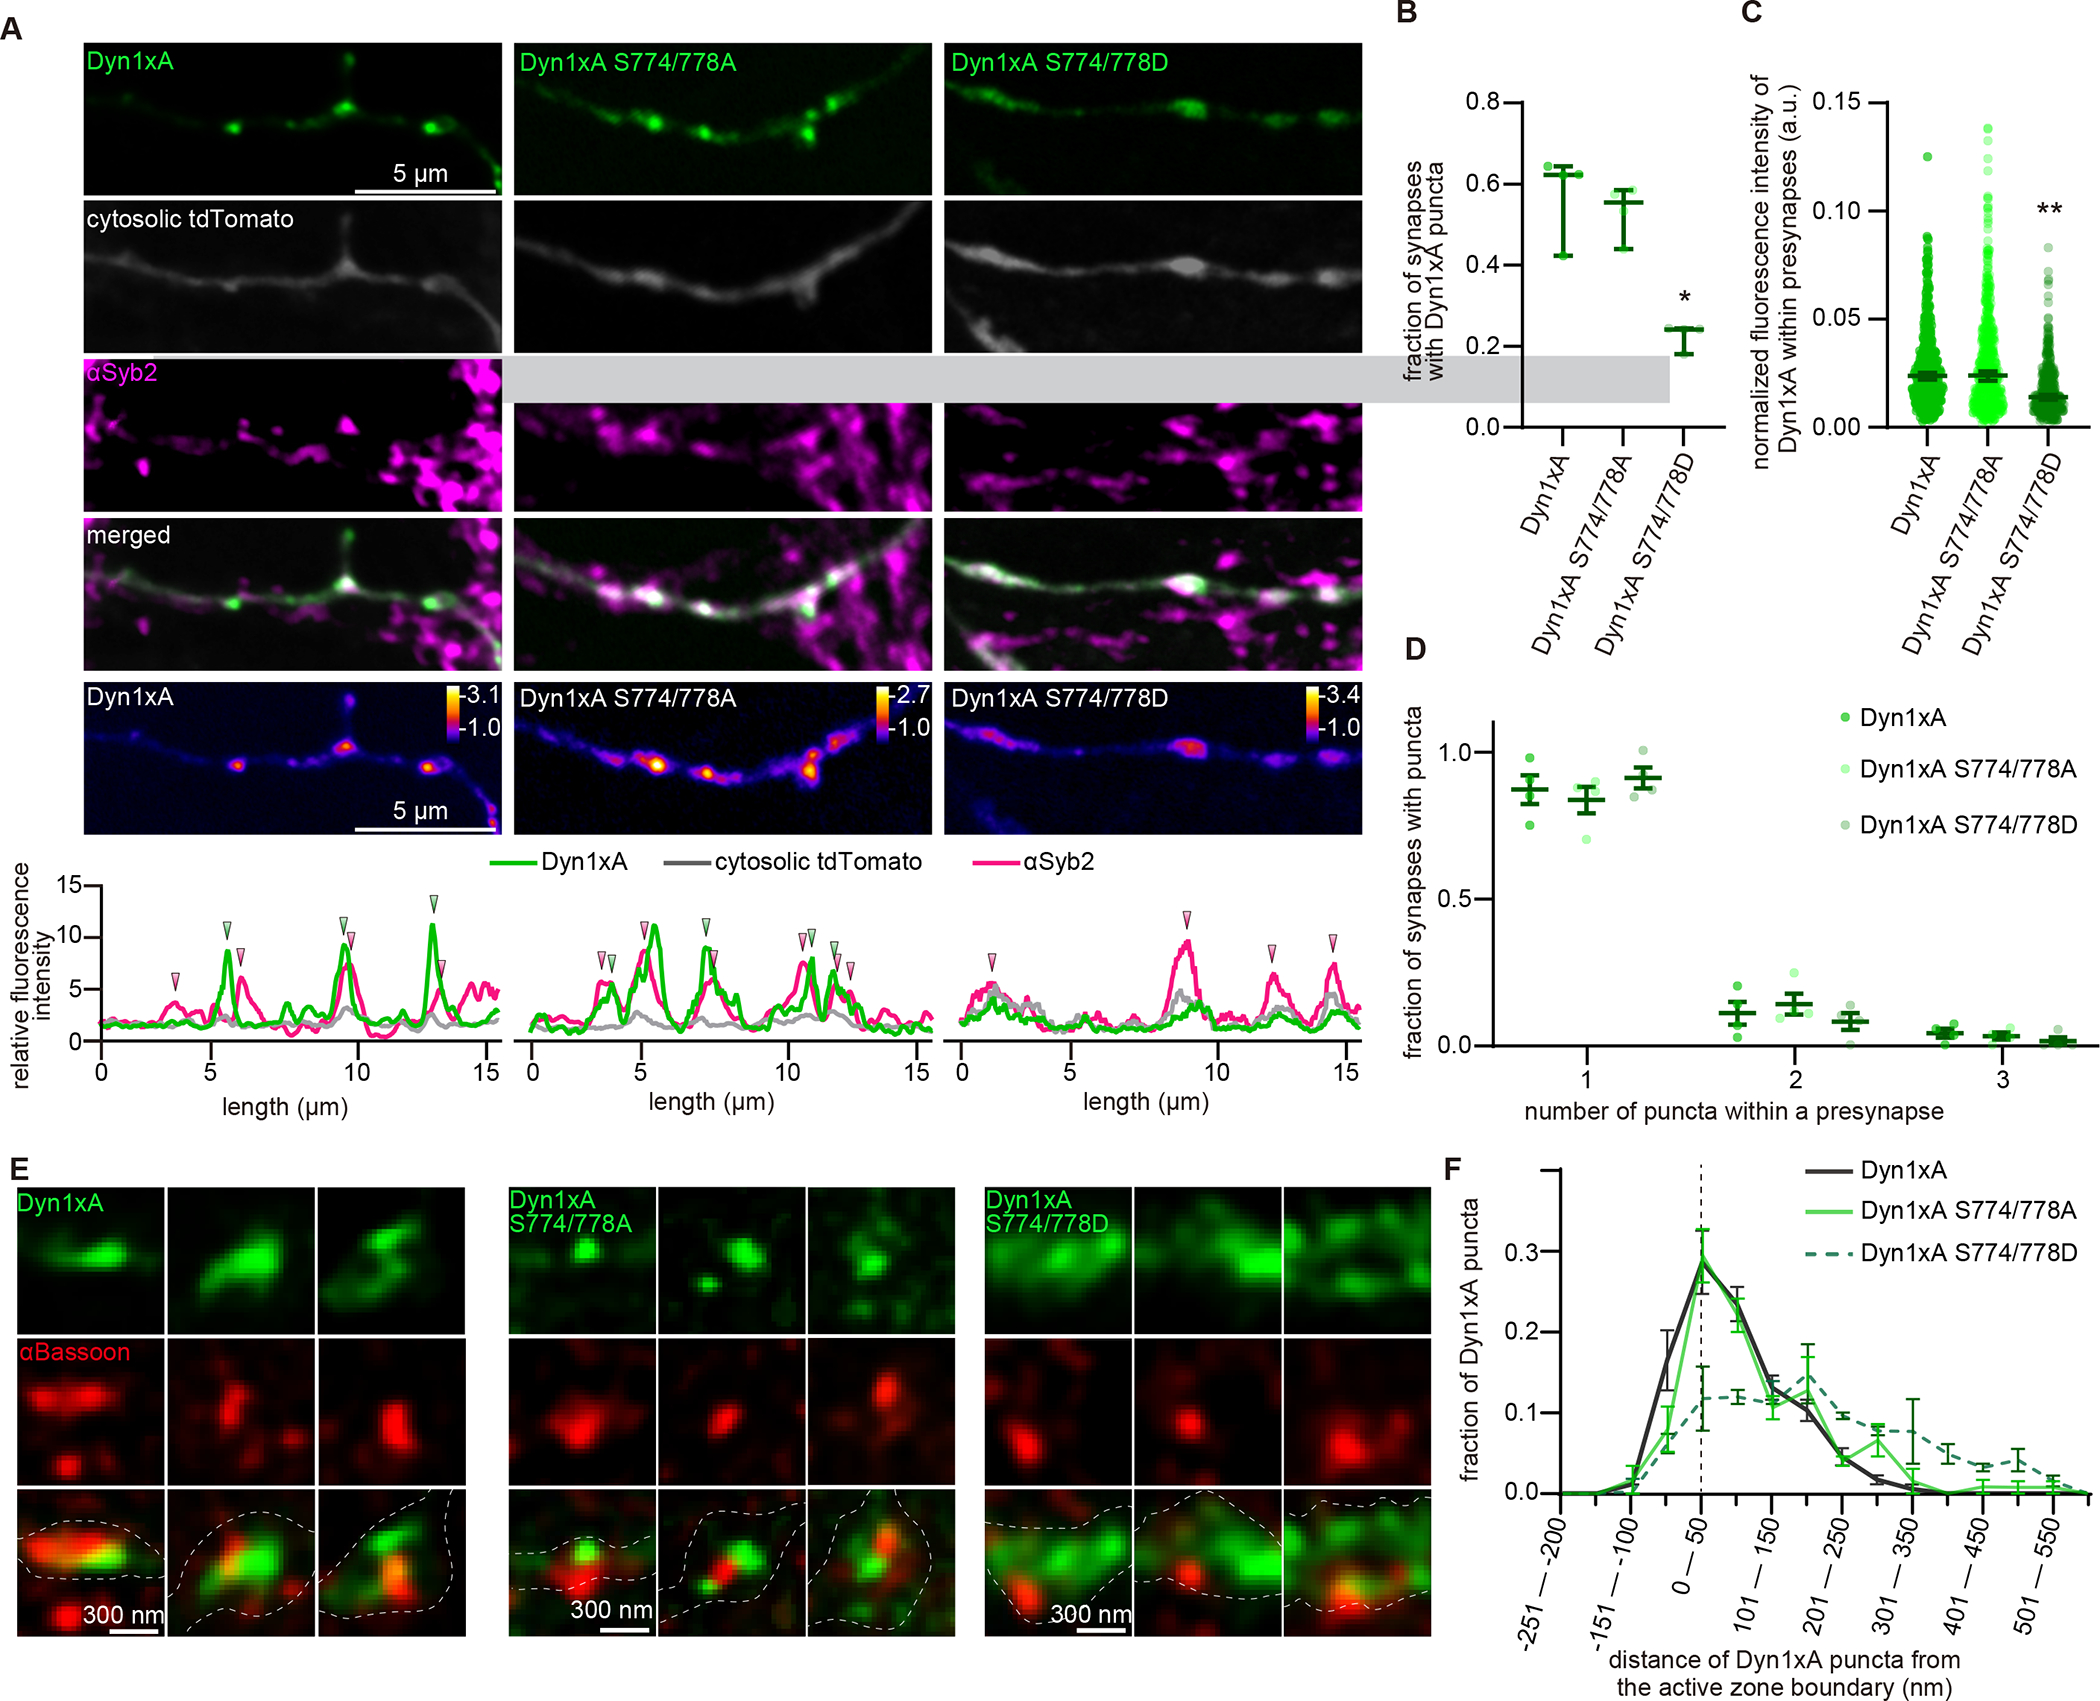
Figure 5. Phase separation of Dyn1xA requires dephosphorylation of the proline-rich motif.

(A) Example confocal micrographs showing overexpression of GFP-tagged Dyn1xA, Dyn1xA S774/778A or Dyn1xA S774/778D, along with exogenously expressed cytosolic tdTomato and immuno-stained αSyb2 in fixed neurons. False-colored images (bottom panels) show the relative fluorescence intensity of Dyn1xA, Dyn1xA S774/778A or Dyn1xA S774/778D. Line scan graphs represent the relative locations of Dyn1xA, Dyn1xA S774/778A or Dyn1xA S774/778D to cytosolic tdTomato and αSyb2.
(B) The fraction of presynapses that contain Dyn1xA, Dyn1xA S774/778A or Dyn1xA S774/778D puncta. Each dot represents one neuron.
(C) The normalized fluorescence intensities of Dyn1xA, Dyn1xA S774/778A or Dyn1xA S774/778D within presynaptic terminals. Each dot represents one synapse.
(D) Relative frequency distributions of the number of puncta within presynaptic boutons among those that contain at least one punctum in neurons expressing Dyn1xA, Dyn1xA S774/778A or Dyn1xA S774/778D puncta within presynapse. The fraction is calculated from each neuron.
(E) Example STED micrographs showing the localization of Dyn1xA or Dyn1xB (stained with anti-GFP antibodies) and αBassoon (stained with anti-Bassoon antibody).
(F) The distribution of Dyn1xA or Dyn1xB relative to the active zone edge.
*p < 0.05, **p < 0.0001. See Data S1 for the n values, statistical test, and detailed numbers.
