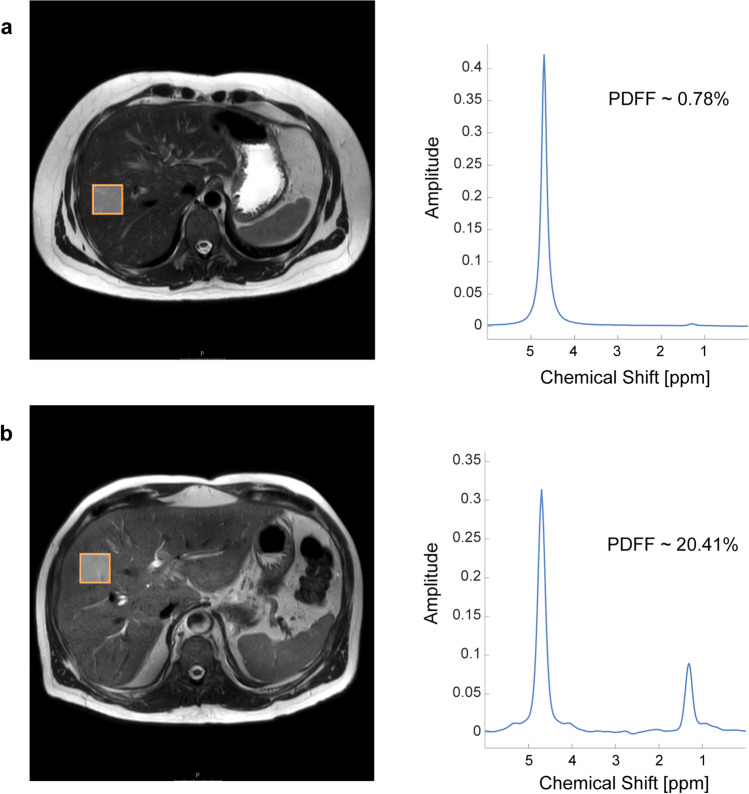
Fig. 2.
T2-weighted images (left) with schematic placement of 1H-MRS voxels (3 × 3 × 3 cm) placed in the right hepatic lobe and corresponding in vivo MRS spectra (right) for water (peak, 4.7 ppm) and triglycerides (peak, 1.3 ppm) for calculation of proton density fat fraction (PDFF) in a subject with a normal liver and in a patient with b NAFLD. Abbreviations: 1H-MRS, proton magnetic resonance spectroscopy; PDFF, proton density fat fraction; ppm, parts per million

