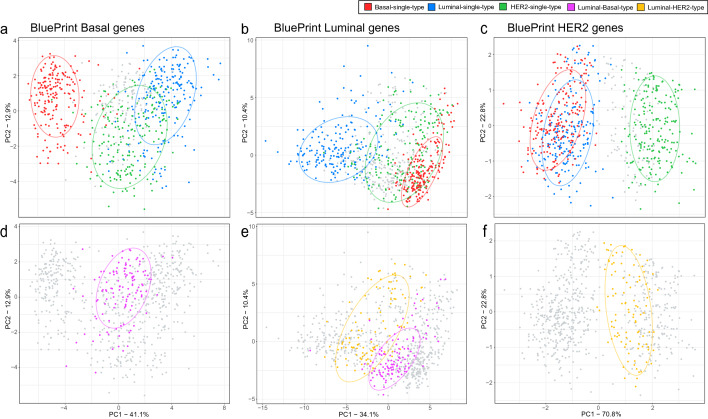
Fig. 1.
Principle component analysis using the three BluePrint signature gene sets (Basal-type, N = 28, panels a and d; Luminal-type, N = 58, panels b and e; HER2-type, N = 4, panels c and f). The x-axis shows variance explained for the first principle component (PC) and the y-axis show the variance explained for the second PC of the correspondent BluePrint signature gene set. a–c Clustering of Basal-single-type, Luminal-single-type, and HER2-single-type samples based on BluePrint signature genes. d–f Clustering of Luminal-Basal-type and Luminal-HER2-type based on BluePrint signature genes. a–c shows coloring of single subtype samples (blue, Luminal-single-type; green, HER2-single-type; red, Basal-single-type) whereas the dual subtype samples are colored grey. d–f shows this in reverse where the dual subtypes are colored (yellow, Luminal-HER2-type; pink, Luminal-Basal-type) and the single subtypes are shown in grey. The ellipses reported in each subfigure illustrate the 80% confidence intervals of the single and dual subtypes

