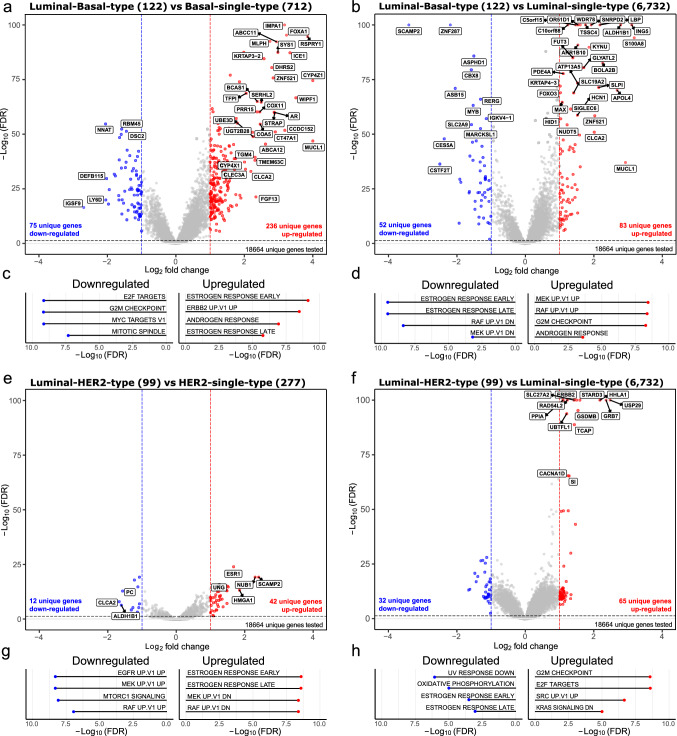
Fig. 2.
Differential gene expression analysis between BluePrint single and dual subtypes. The x-axis and y-axis report the Log2 fold change and the FDR-adjusted p-values (− Log10(FDR)), respectively. Number of tumor samples used for the analysis are shown in between brackets in titles. Significance thresholds of ≤ 0.05 FDR and a log2 fold change of ≥ 1 were used. Red and blue dots illustrate significant differentially expressed genes. The strongest differentially expressed genes are labeled (abs(logFC) ≥ 2 or −Log10 adj p-value ≥ 50). Differentially expressed genes are identified in the following comparisons: a Luminal-Basal-type versus Basal-single-type. b Luminal-Basal-type versus Luminal-single-type, e Luminal-HER2-type versus HER2-single-type, and f Luminal-HER2-type versus Luminal-single-type. Similarly, differentially expressed pathways are shown between c Luminal-Basal-type versus Basal-single-type. d Luminal-Basal-type versus Luminal-single-type, g Luminal-HER2-type versus HER2-single-type, and h Luminal-HER2-type versus Luminal-single-type. FDR = false discovery rate, UP = upregulated, DN = downregulated

