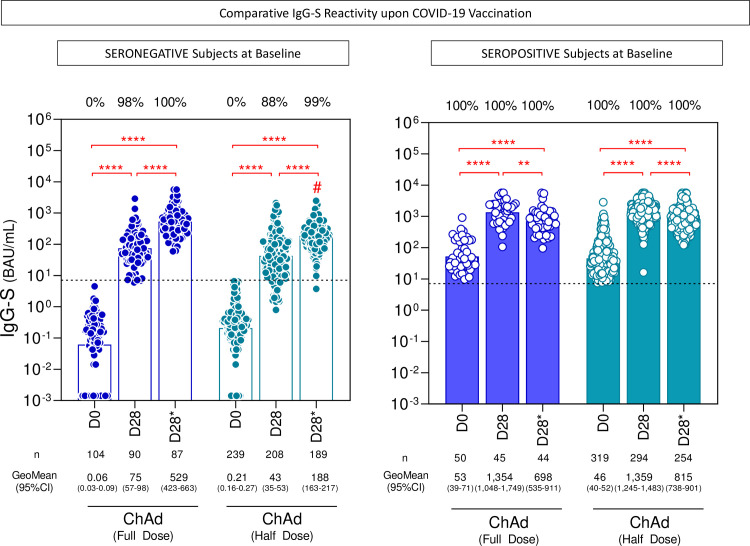
Figure 3.
SARS-CoV-2 IgG-S reactivity upon COVID-19 vaccination. The titers of IgG antibodies to SARS-CoV-2 spike receptor-binding domain (IgG-S) were analyzed in serum samples from subjects with seronegative and seropositive status at baseline at consecutive timepoints: prior (D0), after first (D28) and second (D28*) doses, including subjects receiving a half dose (ChAd Half Dose, n = 239, 208, 189 and 319, 294, 254, respectively), represented by light blue symbols on the right side of each graph, compared to reference volunteers receiving the standard dose (ChAd Full Dose, n = 104, 90, 87 and 50, 45, 44, respectively), represented by dark blue symbols on the left side of each graph. The levels of IgG-S were determined by the chemiluminescent microparticle immunoassay as described in the Methods. The seropositivity was defined for titers ≥ 7.1 BAU/mL (dashed line). Data are presented as a scatter plot of IgG-S titers at D0, D28, and D28* over bars representing the geometric mean (GeoMean) titers. The chi-square test was employed for comparative analyses of IgG-S seropositivity rates among groups. Multiple comparisons of IgG-S titers among subgroups were carried out by Kruskal-Wallis test followed by Dunn’s post-test for sequential pairwise comparisons. Significant differences were considered at p ≤ 0.05 (* represents the p value power; **p≤0.01, **** p≤0.0001) and are indicated by connecting lines and # symbol for intragroup (D0 vs. D28 vs. D28*) and intergroup ChAd Full Dose versus ChAd Half Dose comparisons, respectively.

