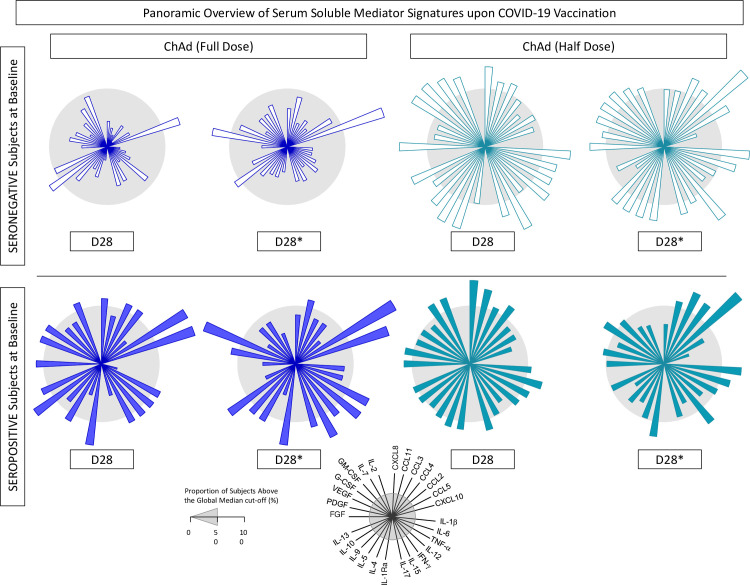
Figure 8.
Panoramic overview of plasma soluble mediator signatures upon COVID-19 vaccination. Overall signature of chemokines (CCL11, CXCL8, CCL3, CCL4, CCL2, CCL5, CXCL10), pro-inflammatory cytokines (IL-1β, IL-6, TNF-α, IL-12, IFN-γ, IL-15, IL-17), regulatory cytokines (IL-1Ra, IL-4, IL-5, IL-9, IL-10, IL-13), and growth factors (FGF-basic, VEGF, PDGF, G-CSF, GM-CSF, IL-7, and IL-2) were collected for subjects with seronegative or seropositive status at baseline in distinct timepoints: after first (D28) and second (D28*) doses, including vaccinees receiving the half dose (ChAd Half Dose), n = 20 and 26, respectively, represented by light blue symbols on the right side of each graph, as compared to the reference volunteers receiving the standard-dose (ChAd Full Dose), n = 18 and 7, respectively, represented by dark blue symbols on the left side of each graph. Signatures of plasma soluble mediators were built as described in the Methods, by first converting the plasma levels of soluble mediators, originally expressed as baseline fold (D28/D0 and D28*/D0) into categorical data (percentual, %) using the median values of each plasma mediator as the cut-off to identify the proportion of subjects above the cut-off edges. The final data are shown in radar chart, with each axis represents one plasma mediators. The 50th percentile (gray zone) was used to underscore the plasma soluble mediators with increased proportion (≥50%) in each study group.

