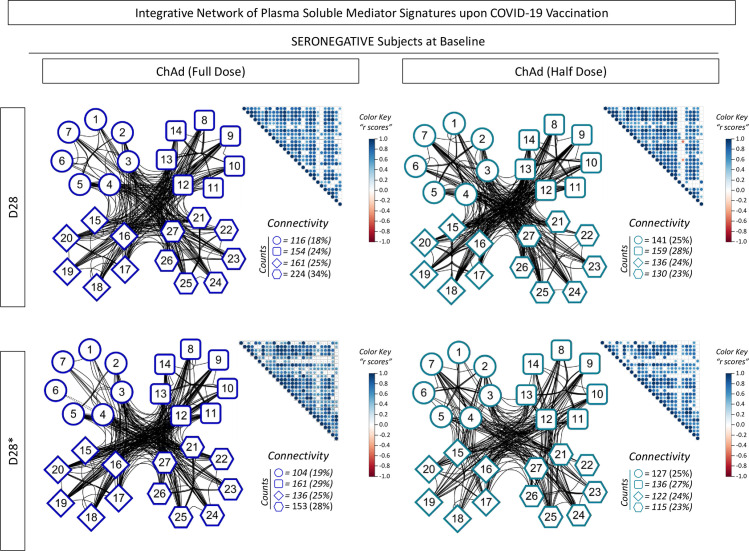
Figure 9.
Integrative network of plasma soluble mediator signatures upon COVID-19 vaccination. Comprehensive correlation matrices were assembled based on the Spearman “r” scores between chemokines (1 to 7, representing: CCL11, CXCL8, CCL3, CCL4, CCL2, CCL5, CXCL10, respectively), pro-inflammatory cytokines (8 to 14, representing: IL-1β, IL-6, TNF-α, IL-12, IFN-γ, IL-15, IL-17, respectively), regulatory cytokines (15 to 20, representing: IL-1Ra, IL-4, IL-5, IL-9, IL-10, IL-13, respectively, and growth factors (21 to 27, representing: FGF-basic, VEGF, PDGF, G-CSF, GM-CSF, IL-7 and IL-2, respectively) measured in plasma samples from subjects with seronegative status at baseline in distinct timepoints: after first (D28) and second (D28*) doses, including subjects receiving the low dose (ChAd Half Dose, n = 20), represented by light blue symbols on the right side of each graph compared to the reference volunteers receiving the standard dose (ChAd Full Dose, n = 18). The soluble mediators were measured by high-throughput microbeads array as described in the Methods. Panoramic correlation overviews are shown as triangle template matrices with each square intersection representing the correlation “r” score between pairs of soluble mediators. The “r” scores are represented by circles of proportional sizes, scaled from -1 to +1 with gradient color key for negative (red circles) or positive (blue circles) correlations. The white squares represent non-significant correlations. Networks were built using a clustered layout, with nodes representing each plasma soluble mediators. Connecting edges illustrate correlations between pairs of attributes. Intrinsic connectivity for each immune mediator category (chemokines=○, pro-inflammatory cytokine=□, regulatory cytokine=◊, and growth factors=o) are provided in the figure.

