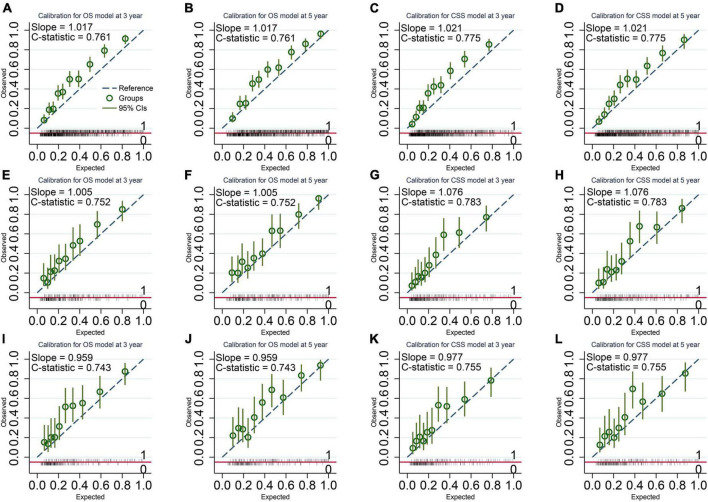
FIGURE 3.
Calibration Plots of the final overall survival (OS) and cancer-specific survival (CSS) models. (A,B) OS model in the imputed training cohort with a C-statistic of 0.761 and a slope of 1.017. (C,D) CSS model in the imputed training cohort with a C-statistic of 0.775 and a slope of 1.021. (E,F) OS model in the complete cases of the validation cohort with a C-statistic of 0.752 and a slope of 1.005. (G,H) CSS model in the complete cases of the validation cohort with a C-statistic of 0.783 and a slope of 1.076. (I,J) OS model in the imputed validation cohort with a C-statistic of 0.743 and a slope of 0.959. (K,L) CSS model in the imputed validation cohort with a C-statistic of 0.755 and a slope of 0.977. The calibration plots show a good agreement between the expected outcome predicted by our model and the observed outcome.

