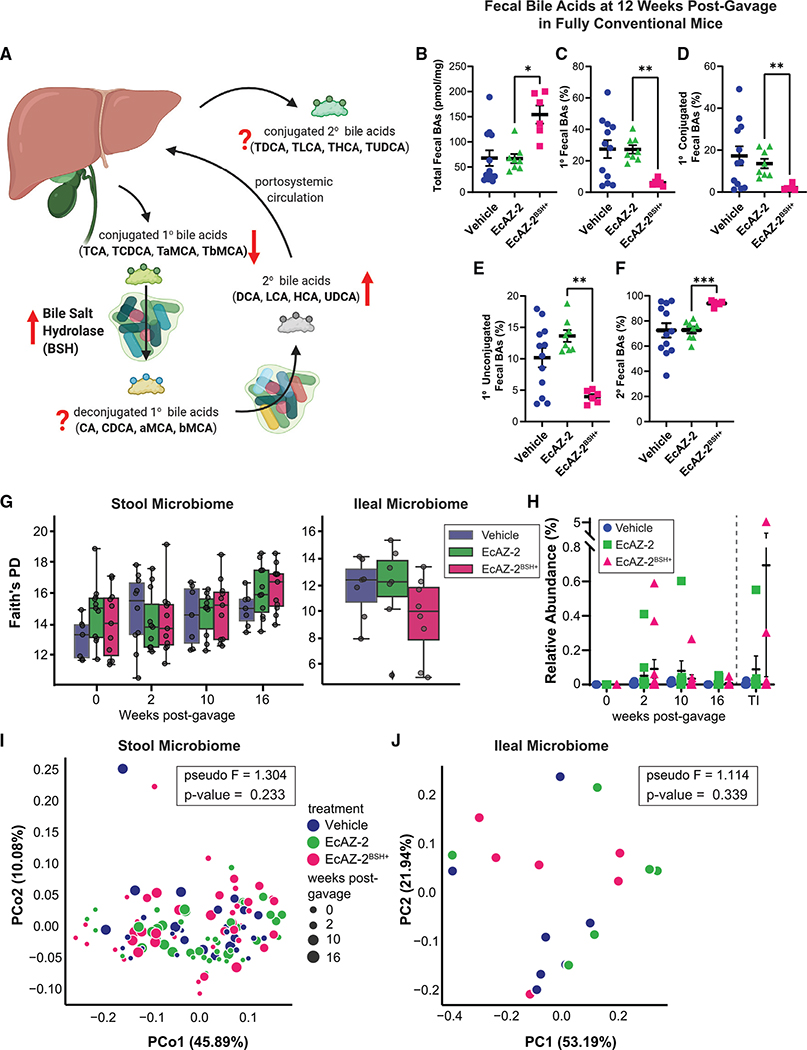
Figure 3. Native E. coli can be used to change luminal metabolome without measurable effects in the microbiome.
(A) Summary diagram showing effects of BSH on fecal bile acid metabolism. The hypothesized effect of increased BSH on the different bile acid pools is shown with red arrows. A question mark denotes uncertainty.
(B–F) (B) Total fecal bile acids, (C) primary bile acids, (D) primary conjugated bile acids, (E) primary unconjugated bile acids, and (F) secondary bile acids in fecal samples collected from mice 12 weeks after a single gavage with vehicle, EcAZ-2, and EcAZ-2BSH+. Significant differences were determined by Kruskal-Wallis test with post hoc Dunn’s multiple comparison test comparing EcAZ-2 and EcAZ-2BSH+.
(G) Faith’s phylogenetic distance (a measure of α-diversity) from 16S rRNA gene sequencing performed on stool samples collected pre-treatment and at 2, 10, and 16 weeks post-gavage (left) and from the terminal ileum samples at the time of euthanasia (right).
(H) Relative abundance of E. coli as detected by 16S rRNA gene sequencing performed on stool samples collected pre-treatment and at 2, 10, and 16 weeks post-gavage and from the terminal ileum samples at the time of euthanasia.
(I) Principal coordinate analysis of weighted UniFrac β-diversity of the fecal samples collected pre-treatment and at 2, 10, and 16 weeks post-gavage.
(J) Principal coordinate analysis of weighted UniFrac β-diversity of the terminal ileum microbiome at the time of euthanasia.
(A) was created with BioRender.com.
See also Figure S3.

