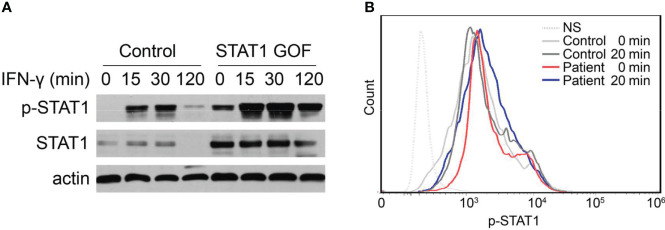
Figure 3.
Enhanced STAT1 and p-STAT1 expression in the GOF patient. (A) Evaluation of STAT1 and p-STAT1 protein level in the GOF patient and healthy control by immunoblotting, at rest, 15′, 30′, 120′ after IFN-γ stimulation. (B) Patient and healthy control p-STAT1 level 20min after IFN-γ stimulation, as measured by flow cytometry.

