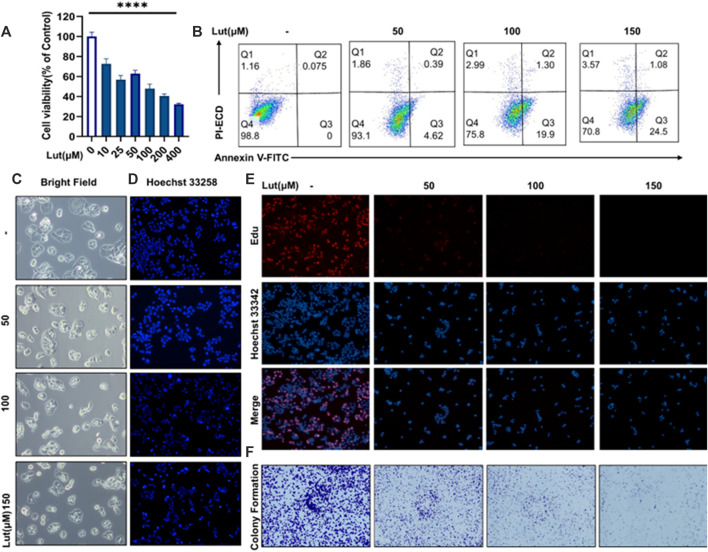
FIGURE 1.
The effect of luteolin on the viability of HT-29 cells after 24 h of treatment. (A) Cells were treated with different concentrations of luteolin (10 μM, 25 μM, 50 μM, 100 μM, 200 μM and 400 μM), and the effect of luteolin on HT-29 cell inhibition was measured by CCK8. The results are presented as the mean ± SEM, n = 6. *p < 0.05, **p < 0.01, and ****p < 0.0001 vs. the control group. (B) Apoptosis was analysed by Annexin V‐FITC/PI staining and flow cytometry analysis. (C) Under a microscope, morphological alterations in the cells were observed. (D) Hoechst 33258 fluorescence staining was used to assess the changes in nuclear shrinkage of HT-29 cells treated with 0 μM, 50 μM, 100 μM and 150 μM luteolin for 24 h. (E) The effect of luteolin on the growth of colorectal cancer cells was studied using the EdU proliferation assay. Blue luminous cells indicate all of the cells, whereas red fluorescent cells are those in the S phase of mitosis. (F) Effects of different concentrations of luteolin on the colony formation of HT-29 cells.

