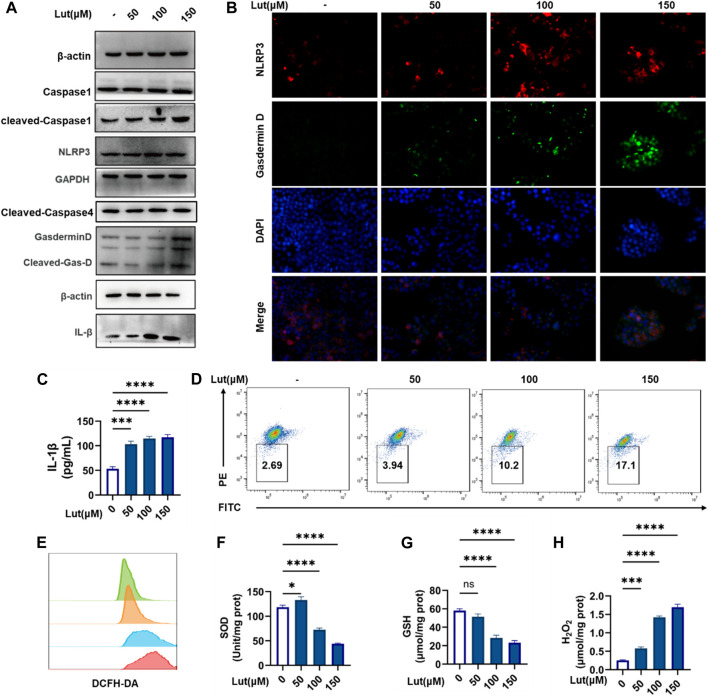
FIGURE 2.
Luteolin induced pyroptosis and oxidative stress in HT-29 cells. (A) Control and luteolin-treated HT-29 cells were collected and analysed by WB to measure the expression levels of NLRP3, ASC, Pro-Caspase1, Caspase1, GSDMD, Cleaved-GSDMD (N-T), and IL-1β. GAPGH and β-actin served as internal controls. (B). Immunofluorescence colocalization of NLRP3 with GSDMD in control and luteolin-treated cells. Cells were double labelled with antibodies specific for NLRP3 (Cy3) and GasderminD (FITC). DAPI was used to stain the nucleus blue. The cells that are labelled with three colours are those where pyroptosis occurred. (C) Control and luteolin-exposed HT-29 cells were harvested, and the IL-1β contents in cell supernatants were measured by ELISA. (D) The control and luteolin-treated HT-29 cells were harvested and analysed by flow cytometry to investigate the change in mitochondrial membrane potential. (E) Intracellular ROS production was assessed by flow cytometry. Green: control group, orange: 50 μM luteolin group, blue: 100 μM luteolin group, red: 150 μM luteolin group. (F) The SOD kit was used to measure the different SOD contents in cells. (G) The SOD kit was used to measure the different SOD contents in the cells. (H) The production of H2O2 in the cells of the control group and luteolin treatment group was measured. The results are presented as the mean ± SEM, n = 6. *p < 0.05, **p < 0.01, and ****p < 0.0001 vs. the control group.

