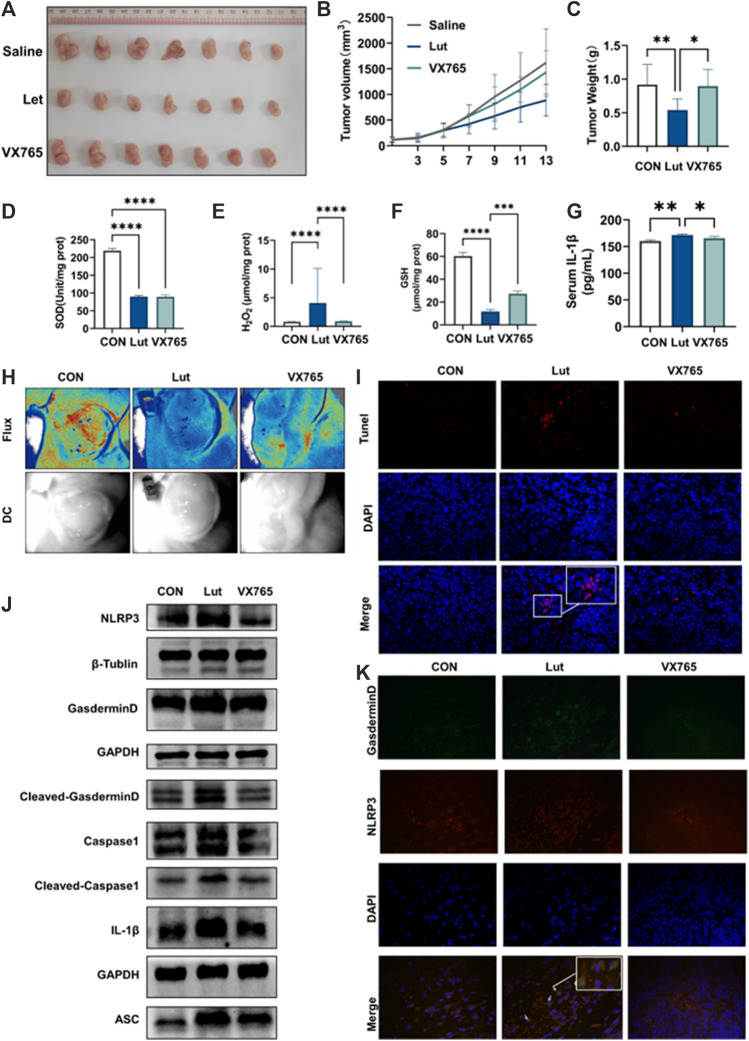
FIGURE 5.
Effects of luteolin on tumours in vivo. (A) Tumours in mice. (B) Tumour volume was measured every 2 days. Tumour volume = 0.5× maximum diameter × minimum diameter squared. (C) Tumour weight. (D) SOD content in tumours. (E) H2O2 content in tumours. (F) GSH content in tumours. (G) The content of IL-1 in the serum of mice was determined by ELISA. (H) Image of angiogenesis in tumours. Red indicates blood flow. (I) TUNEL staining of tumour tissues (J) Tumour tissues of control, luteolin-, and VX765-treated mice were collected, and the expression levels of NLRP3, ASC, Pro-Caspase1, Caspase1, GSDMD, Cleaved-GSDMD (N-T), and IL-1β were analysed by WB. GAPGH and β-actin were used as internal controls. (K) Immunofluorescence colocalization of the NLRP3/GSDMD proteins in mouse tumour tissues.

