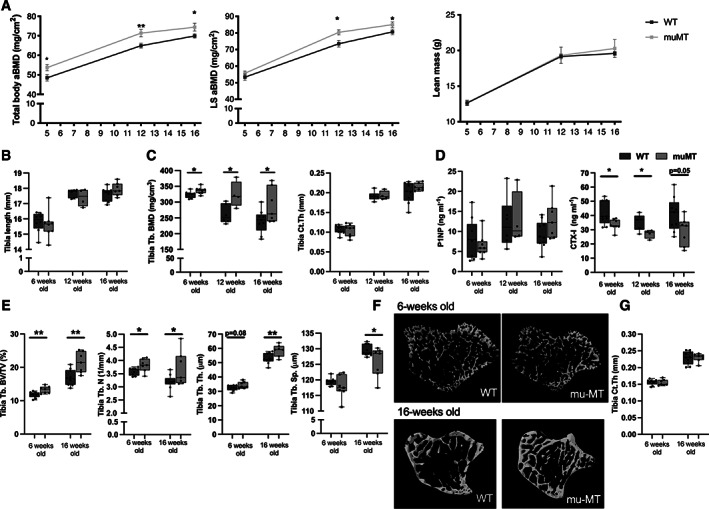
Fig. 2.

Mice deficient in mature B cells and immunoglobulins show increased trabecular bone. (A) Total body aBMD, LS L3–L6 aBMD, and lean mass measured with DXA in 5‐week‐old, 12‐week‐old, and 16‐week‐old female muMT and WT littermate mice. *Indicates significant differences determined with Student's t test. n = 7–10. (B) Tibia length, (C) Tb.BMD, and Ct.Th were analyzed with pQCT in 6‐week‐old, 12‐week‐old, and 16‐week‐old female muMT and WT littermate mice. (D) Serum levels of P1NP (bone formation marker) and CTX (bone resorption marker). n = 4–9. (E) Trabecular BV/TV, Tb.N, Tb.Sp, and Tb.Th analyzed with high‐resolution μCT in 6‐week‐old, and 16‐week‐old female muMT and WT mice. (F) Representative images of trabecular bone in muMT and WT littermates. (G) Ct.Th was analyzed with μCT. Student's t test was used to assess the differences between muMT and WT littermate mice at each time point. n = 7–10. *p < 0.05, **p < 0.01. aBMD = areal BMD; BMD = bone mineral density; BV/TV = bone volume per total volume; Ct.Th = cortical thickness; LS = lumbar spine; Tb.BMD = trabecular BMD; Tb.N = trabecular number; Tb.Sp = trabecular separation; Tb.Th = trabecular thickness; WT = wild‐type.
