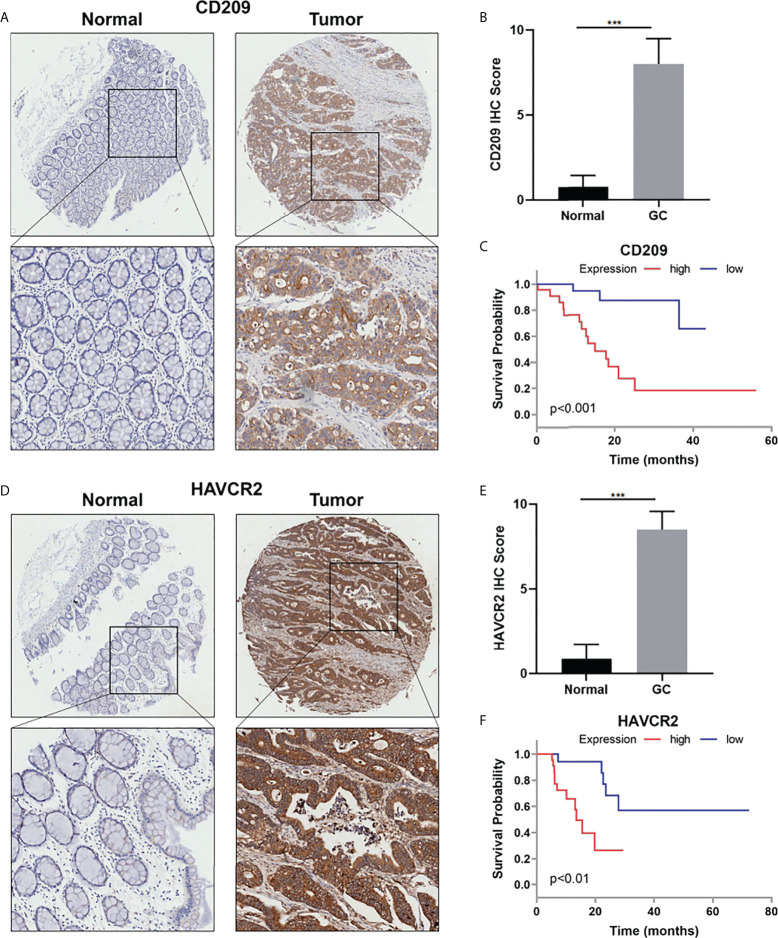
Figure 8.
(A) Representative IHC staining for CD209 in GC and adjacent non-tumor tissues. (B) Quantification of (A). (C) The overall survival analysis was plotted using Kaplan–Meier Plotter for patients with GC by IHC level of CD209. (D) Representative IHC staining for HAVCR2 in GC and adjacent non-tumor tissues. (E) Quantification of (D). (F) The overall survival analysis was plotted using Kaplan–Meier Plotter for patients with GC by IHC level of HAVCR2. ***p value<0.001.

