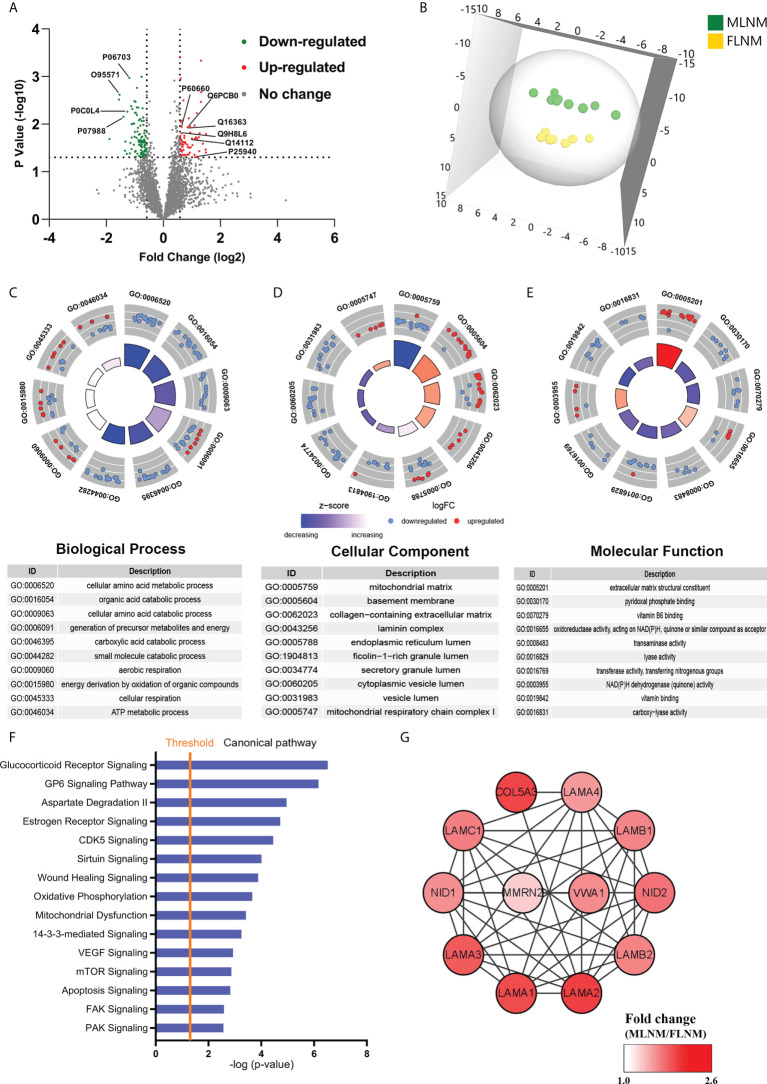
Figure 4.
Comparative analysis of the proteome expression profiles between the MLNM and FLNM groups. (A) Scatter plot showing the distribution of downregulated (green dots) and upregulated (red dots) differentially expressed proteins (DEPs) between the MLNM and FLNM groups. (B) Orthogonal partial least squares discriminant analysis revealed differences in the proteome profiles between the MLNM and FLNM groups. “MLNM” refers to male PTMC patients with lymph node metastasis, and “FLNM” refers to female PTMC patients with lymph node metastasis. (C–E) Gene Ontology analysis revealed enrichment of these DEPs in the biological process (BP), cellular component (CC) and molecular function (MF) categories; (F) Annotation and functional characterization of DEPs. (G) The ECM-related DEPs in the protein-protein interaction (PPI) network are shown as nodes. The intensity of the red colors indicates the ratio of protein abundance in MLNM/FLNM.

