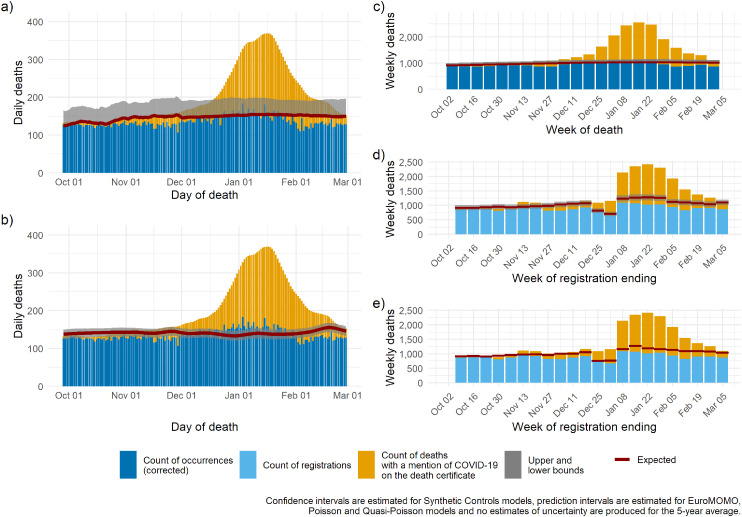
Figure 6.
London: expected deaths and delay-corrected deaths (DOD models) or registered deaths (DOR models) for five models for the period October 2020 through to March 2021: (a) Poisson regression; (b) synthetic controls, (c) EuroMOMO, (d) quasi-Poisson regression, (e) 5-year average.
DOD: date of death; DOR: date of registration; EuroMOMO: European monitoring of excess mortality.

