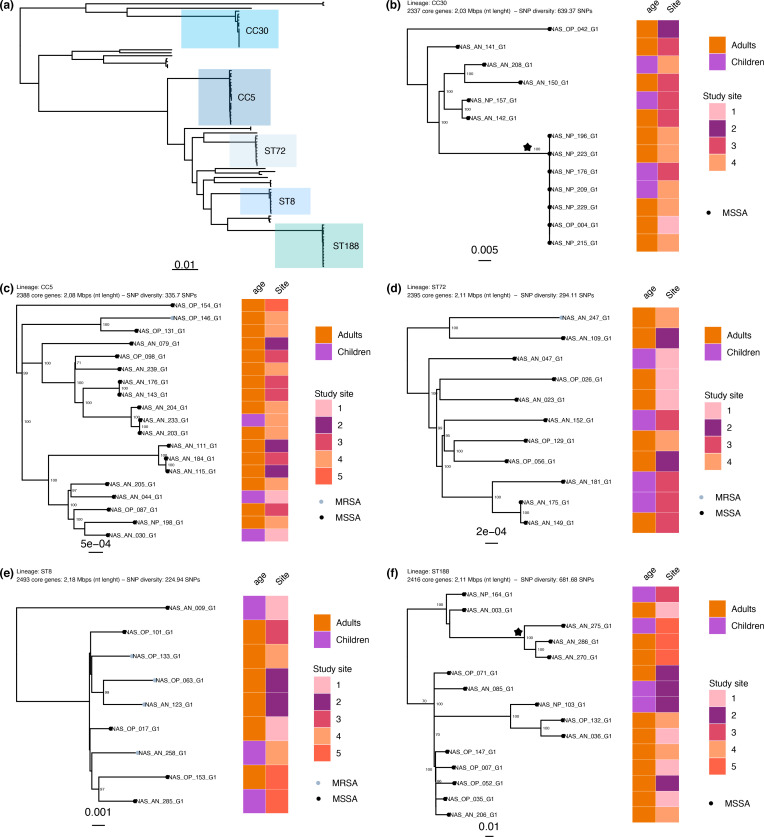
Fig. 3.
Population structure of the S. aureus isolates carried (a) and five dominant lineages (b–f). (a) The maximum-likelihood phylogeny from Fig. 1, with the dominant lineages indicated. (b–f) Lineage (ST or CC), number of core genes, nucleotide length of the core genome and the mean pairwise SNP diversity are shown. The tips of the phylogeny are coloured according to meticillin susceptibility (MSSA; black) or resistance (MRSA; grey). Bootstrap statistical support values are annotated on the branches of the phylogeny and the branch length scales are shown at the bottom of each panel. The heatmap to the right shows the age group and deidentified study site associated with the isolate. The clades annotated with a star have a mean SNP difference of 0 SNPs (CC30) and 306 SNPs (ST188). The scale bar indicates genetic distance.

