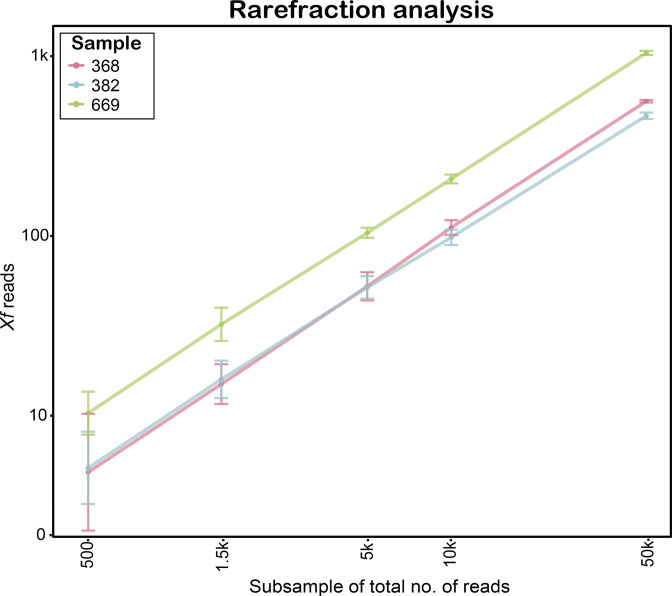
Fig. 2.
Detection sensitivity of metagenomic sequencing with the ONT MinION based on wimp [28] analysis for samples 368, 382 and 669. The x-axis shows the total number of reads that were randomly subsampled. The y-axis reports the corresponding mean number of X. fastidiosa (Xf) reads based on ten subsamples taken for each subsample size. The error bars show the standard deviation.

