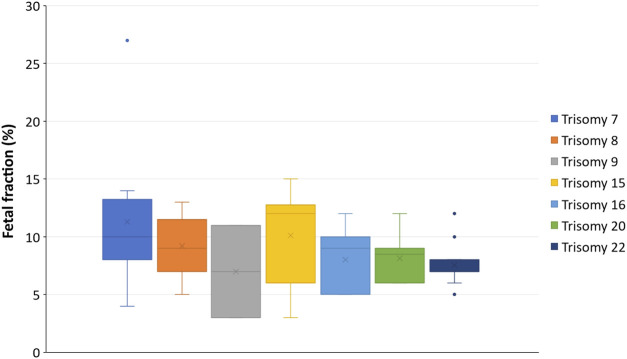
FIGURE 2.
Relationship between fetal fraction and RAAs per chromosome. The box plots represent the first and third quartile (upper and lower margins of the box, respectively), the minimum and maximum FF values (lower and upper whiskers, respectively), the median FF (horizontal line within the box), and the mean FF (X within the box). The dots are outliers.

