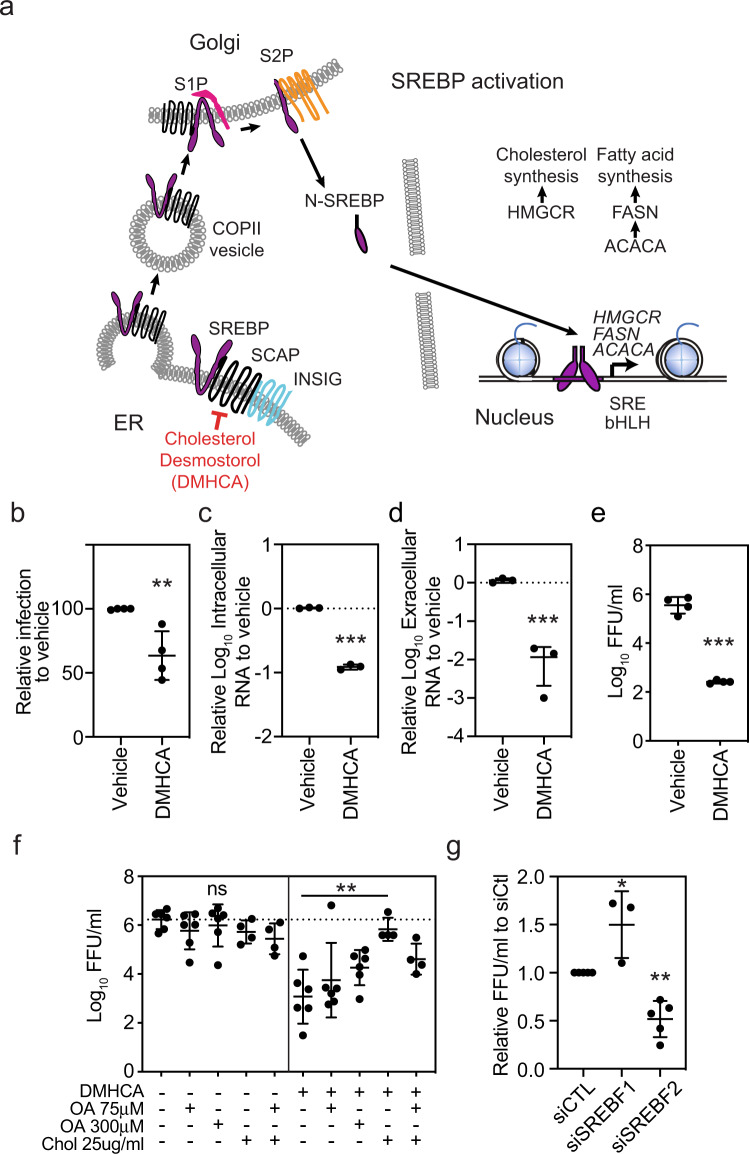
Fig. 5. Treatment of moDCs with the SREBP2 inhibitor DMHCA suppresses ZIKV infection.
a Simplified model of the SREBP activation pathway. b moDCs were treated with vehicle (ethanol) or DMHCA (10 μM) for 4 h, infected with ZIKV PRVABC49 (MOI 1) for 24 h, and ZIKV-infected cells were quantified by 4G2 staining and flow cytometry. c–e moDCs were infected with ZIKV PRVABC49 (MOI 1) and treated with DMHCA (10 μM) at 2.5 h post infection (pi). At 24 h pi, c intracellular and d extracellular ZIKV RNA were quantified by qRT-PCR and e infectious virions were quantitated by focus-forming assay (FFA). Data are presented as the mean ± SD. n = 4 (b, e) or n = 3 (c, d) biologically independent experiments. f moDCs were infected with ZIKV PRVABC59 (MOI 1) for 1 h, washed, and treated with vehicle (left) or DMHCA 10 μM (right) in the presence or absence of oleic acid–BSA (OA) and/or cholesterol–methyl-β-cyclodextrin (Chol) at the indicated concentrations. At 24 h pi, infectious virions were quantitated by FFA. Data are presented as the mean ± SD. n = 4, for Chol treatment, or n = 6, for all other treatments, biologically independent experiments. g moDCs were transfected with siRNAs targeting SREBF1 or SREBF2 for 24 h before infection with ZIKV SD001 (MOI 0.5). At 24 h pi, infectious virions in the supernatants were quantified by FFA. Data are presented as the mean ± SD. n = 5 (siCTL, siSREBF2) or n = 3 (siSREBF1) biologically independent experiments. Symbols represent moDCs derived from individual donors. **P < 0.01, ***P < 0.001 by two-sided unpaired t test (b–e) or one-way ANOVA with Dunnett’s correction for multiple comparisons (f, g). Source data and exact P values are provided as a Source Data file.

