FIGURE 5.
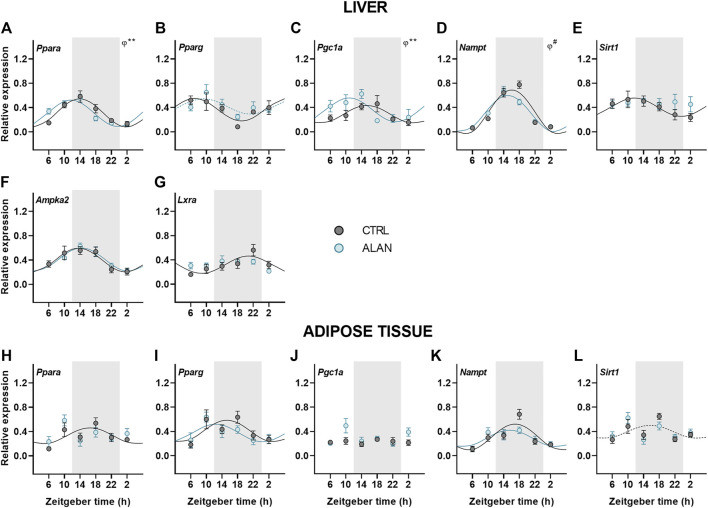
Dim ALAN affected rhythmic expression of metabolic sensors. Rats were kept either in the standard LD regime (CTRL; grey) or exposed to dim light at night (ALAN; blue) for 2 weeks. Relative mRNA levels of metabolic sensors in the liver (A–G) and adipose tissue (H–L). Grey area indicates the dark/dim light phase. Data represent mean ± SEM with n = 5-6 per group. Solid lines indicate the significant daily rhythms (p < 0.05) and dashed lines show rhythms with a trend to significance (p-value between 0.05 and 0.1). Missing lines represent non-significant 24-h rhythm. Significant changes in acrophase (φ) revealed by Wald tests are specified by **p < 0.01 and # a trend to significance (p-value between 0.05 and 0.1).

