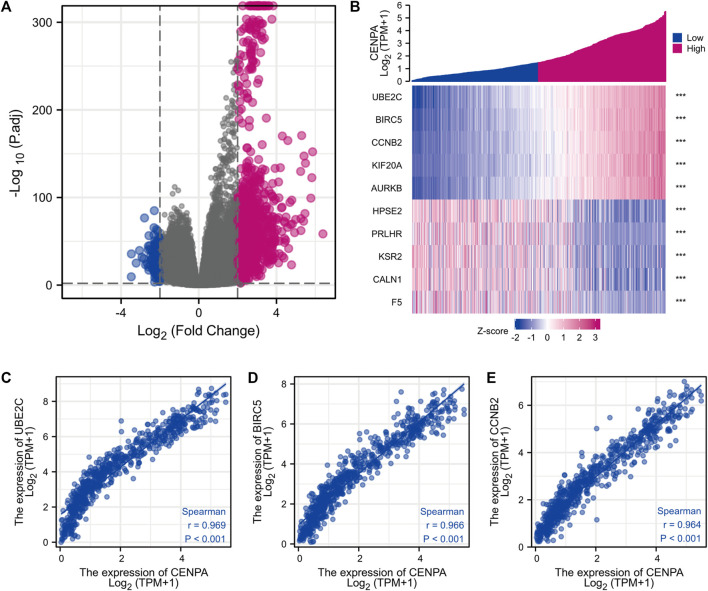
FIGURE 5.
Differentially expressed genes (DEGs) between high and low CENP-A expression glioma groups in TCGA dataset. (A) Heatmap of the top five upregulated and downregulated DEGs. (B) Volcano plot of DEGs expression profiles. (C–E) Scatter plot showing the correlation between CENP-A expression and UBE2C (C), BIRC5 (D), and CCNB2 (E) expression.

