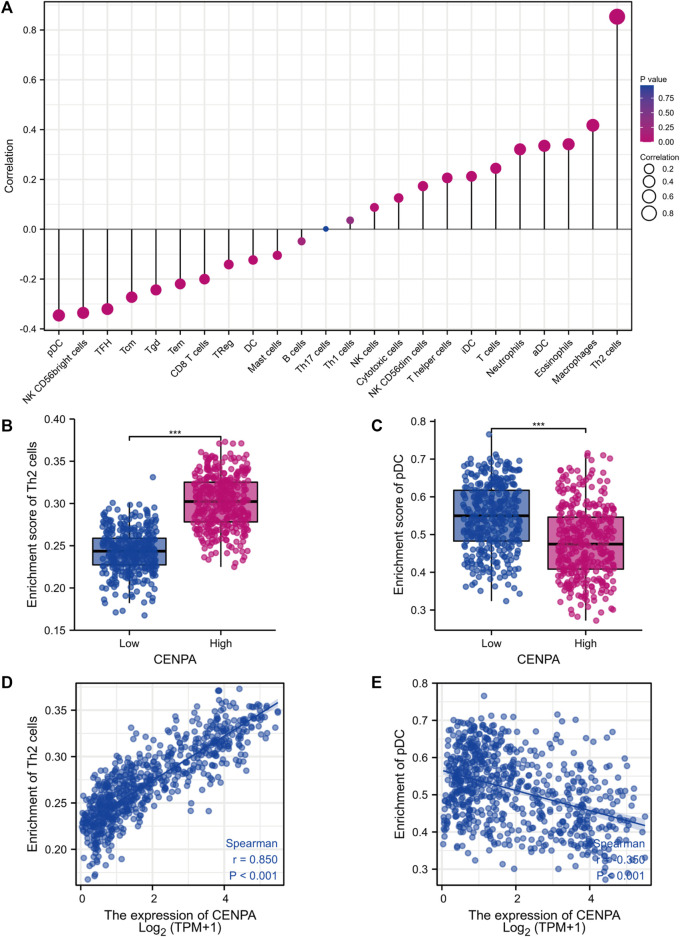
FIGURE 8.
The role of CENP-A in tumor immune responses. (A) A forest plot showing the association between CENP-A expression and immune infiltration level. (B,C) The abundances of Th2 cells and pDC cells among low- and high-CENP-A expression groups. (D,E) The correlation between CENP-A expression levels and the relative enrichment levels of Th2 and pDC cells.

