FIGURE 2.

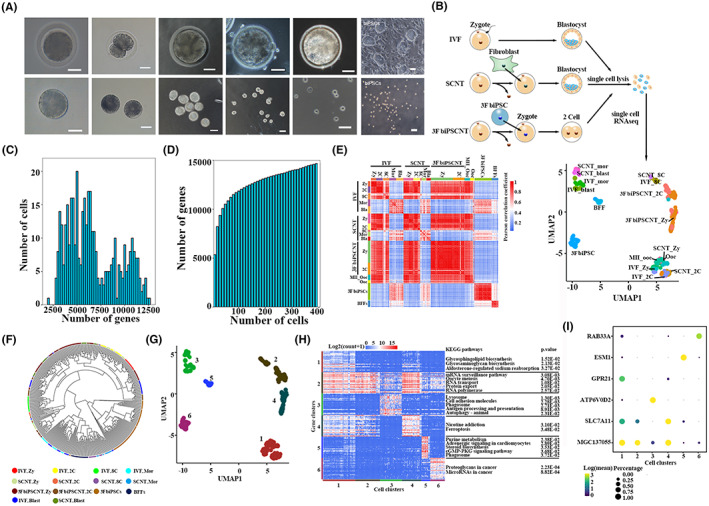
Single‐cell transcriptomic profiling of three types of bovine early embryos. (A) Microscopy imaging of bovine preimplantation IVF embryos at zygote, 2‐cell, 8‐cell, morula and blastocyst stages and their corresponding isolated single cells, 3F biPSC colonies, and their single cells. Scale bar, 50 μm. (B) Sampling of single cells from bovine embryos at zygote, 2‐cell, 8‐cell, morula and blastocyst development stages, as well as cDNA library preparation and single cell RNA sequencing. The dimension reduction analysis and cell clustering were based on the Uniform Manifold Approximation and Projection (UMAP) algorithm. (C) Distribution of the number of genes detected in 384 high‐quality single cells. (D) The cumulative number of genes detected in 384 high‐quality single cells. (E) Heatmaps showing Pearson correlation coefficients (PCC) between pairs of cells among each development stage and embryo type. (F) Hierarchical clustering among 384 single cells. (G) Based on the UMAP plot in Figure 2B, all single cells were divided into six clusters. (H) Heatmaps showing the expression patterns of 150 markers in six cell clusters, the enriched KEGG pathways listed right side. (I) Bubble chart exhibited the expression patterns of Top 1 marker in six cell clusters
