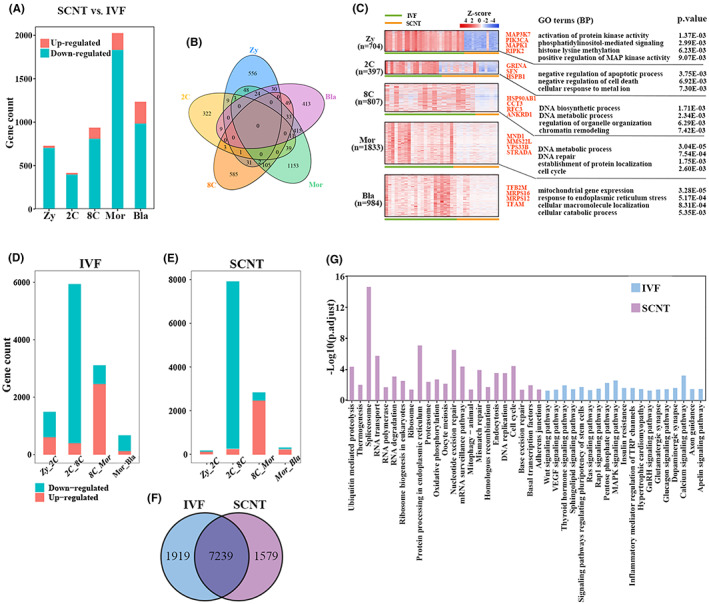
FIGURE 3.

Different gene expression between SCNT embryos and IVF embryos. (A) Histogram represent the number of DEGs of each developmental stage in SCNT embryos compared to IVF embryos. (B) Overlaps among down‐regulated genes at each developmental stage (SCNT vs. IVF). (C) The expression patterns of down‐regulated genes (SCNT vs. IVF) in each developmental stage of IVF and SCNT embryos. The developmental stages and DEGs number were shown in the left. The enriched biological processes and representative genes were shown in the right. (D, E) Histogram represent the number of DEGs at the adjacent developmental stages of IVF and SCNT embryos, respectively. (F) Veen diagrams showing the overlapping of the overall DEGs among adjacent developmental stages between IVF embryos and SCNT embryos. (G) The enriched KEGG pathways of the specific DEGs in IVF embryos (n = 1919) and SCNT embryos (n = 1579)
