FIGURE 5.

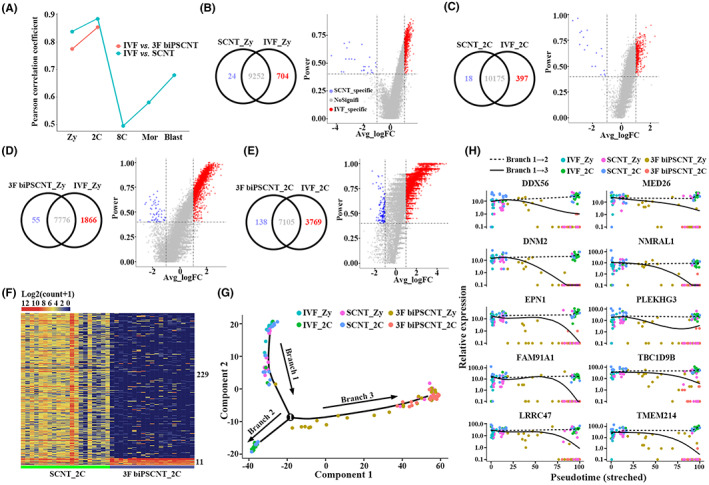
Compared with IVF embryos, 3F biPSCNT embryos showed greater differences than SCNT embryos. (A) A line graph of the Pearson correlation coefficients between cells of two types of nuclear transfer embryos and cells of IVF embryos at the corresponding developmental stage. (B–E) The venn diagrams and volcano diagrams showed the expression patterns of differentially expressed genes (DEGs) in SCNT embryos and 3F biPSCNT embryos compared to IVF embryos. (F) Expression patterns of differentially expressed genes between SCNT embryos and 3F biPSCNT embryos at the 2‐cell stage. (G) Pseudotime analysis of IVF, SCNT and 3F biPSCNT embryos from zygotes to the 2‐cell stage. The IVF and SCNT embryos appeared in branches 1 and 2, whereas 3F biPSCNT embryos appeared in branches 1 and 3. (H) The 10 genes that potentially regulated the development fate of nuclear transfer embryos were down‐regulated in 3F biPSCNT embryos from zygote to 2‐cell stage (branches 1–3) and have stable expression levels in IVF and SCNT embryos (branches 1–2)
