

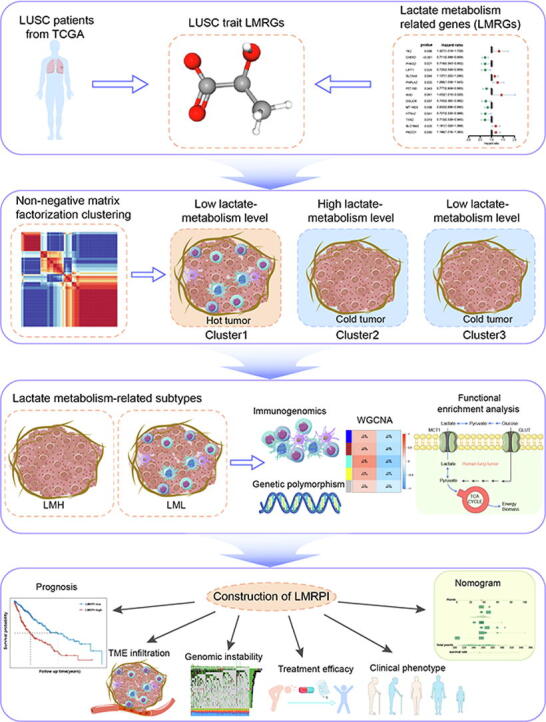
Graphical abstract
Keywords: Lung squamous carcinoma, Metabolic reprogramming, Lactate metabolism, Immunogenomics, Immune checkpoint therapy, Prognosis biomarker
Highlights
-
•
Multi-omics analysis to analyze the effect of lactate metabolism on LUSC phenotype.
-
•
Lactate metabolism and immunogenomics crosstalk analysis to identify LUSC subtypes.
-
•
Lactate metabolism can reflect the level of LUSC metabolic reprogramming.
-
•
LMRPI can predict the prognosis of LUSC patients and guide individualized treatment.
Abstract
Lung squamous carcinoma (LUSC) is a malignant tumor of the respiratory system with highly heterogeneous characteristics. Lactate is the main product of aerobic glycolysis during the metabolic reprogramming of tumors. There is growing evidence that lactate metabolic processes have a broad and sophisticated impact on tumor phenotypic plasticity and tumor microenvironment (TME). However, the pattern of lactate metabolism in patients with LUSC and its impact on TME, phenotype, prognosis, and treatment have not been fully elucidated. In this study, we identified two subtypes with different lactate metabolism patterns in LUSC by non-negative matrix factorization and explored their multi-omics features. We observed that lactate metabolism levels in LUSC extensively influenced tumor immune infiltration patterns, adaptation to the hypoxia environment, and energy metabolic reprogramming. Subsequently, we constructed the lactate metabolism-related prognostic index (LMRPI) using Cox stepwise regression analysis. LMRPI showed excellent stability and accuracy, and based on the median value of LMRPI, LUAD were divided into two subgroups. The two subgroups have different patterns of immune infiltration and somatic mutations. Meanwhile, the two subgroups had different responsiveness to immune checkpoint inhibitor (ICI) therapies and different sensitivity to various chemotherapeutic and molecular targeting agents. In conclusion, we defined two subtypes with different lactate metabolism patterns in LUSC and extensively characterized their multi-omics profile. Furthermore, we developed LMRPI that predicts the prognosis of LUSC patients while also predicting their response to various adjuvant therapies, including immunotherapy, to guide their individualized treatment.
1. Introduction
Lung cancer has been the leading cause of cancer-related deaths worldwide in recent decades and it is predicted that an average of 350 people will die from lung cancer every day in the United States in 2022 [1]. From a pathological perspective, lung cancer is classified as small cell lung cancer (SCLC) and non-small cell lung cancer (NSCLC). Lung squamous carcinoma (LUSC) accounts for approximately 30 % of NSCLC and is highly aggressive. Patients with LUSC are typically characterized by an older age, a later stage, a higher incidence of complications, and a poor five-year survival rate [2], [3]. Meanwhile, due to the rarity of activated epidermal growth factor receptor (EGFR) mutations in LUSC, EGFR tyrosine kinase inhibitors (TKIs) used as first-line therapy in NSCLC have been found to be unsatisfactory in LUSC [4]. Although LUSC responds poorly to common adjuvant therapies, immune checkpoint inhibitor (ICI) therapies have shown exciting efficacy in LUSC, and several drugs have already been applied in treatment [5], [6]. However, due to tumor heterogeneity, heterogeneous metabolic phenotypic distribution of tumor cells in tumor microenvironment (TME), and different immune infiltration patterns, the benefit that patients receive from ICI therapy is fraught with uncertainty [7]. Therefore, a simultaneous approach to discriminate different subtypes of LUSC from both metabolic reprogramming and the immune microenvironment of tumors and to predict patients' response to multiple therapies, including ICI therapies, would be a good contribution to individualized treatment.
Reprogramming energy metabolism in tumors is necessary to promote the growth and differentiation of tumor cells [8]. Within tumors, aerobic glycolysis is an aberrant feature of tumor energy metabolism, consuming glucose and producing lactate [9]. For a long time, lactate molecule was regarded only as a metabolic waste product within the tumor, but in recent years its diverse effects in TME have been unveiled. The lactate metabolism plays multiple roles to promote the development and progression of tumors, such as metabolites, tricarboxylic acid (TCA) cycle carbon sources, and signaling molecules, through multiple modalities: formation of lactate-based dual-compartment metabolic couplings to enhance environmental adaptation of tumor cells, promotion of hematologic reconstitution in tumor regions, and assistance in the formation of a suppressive immune environment [10], [11], [12], [13]. Meanwhile, recent studies have found that lactate-based lactylation protein modifications suppress immune cells within the tumor by regulating the phenotype of macrophages [14]. Notably, the impact of lactate metabolism on the functions of immune cells in tumors is extensive and profound. Tumor cells and immune cells compete for glucose and secrete lactate acidified TME through aerobic glycolytic metabolism [15]. In a TME with high lactate concentrations, multiple effector T cell subtypes and NK cells become dysfunctional, and cytolytic activity is reduced, whereas Treg cells are unaffected due to different metabolic patterns [16], [17]. Given the complex role of lactate metabolism on the immune environment within the tumor, exploring the ways that lactate metabolism-related genes (LMRGs) interact in LUSC might be instrumental in understanding the biology characteristics and predicting the response to ICIs therapies.
In our study, we identified two LUSC subtypes with different lactate metabolism levels based on The Cancer Genome Atlas (TCGA). We also systematically analyzed the effect of the levels of lactate metabolism on the biological characteristics for LUSC through multiomics study. Subsequently, we constructed and validated a lactate metabolism-related prognostic indictor (LMRPI) based on hub LMRGs to assess the prognosis of LUSC patients. We also evaluated the immune infiltration characteristics of LMRPI and the relationship with the response to various adjuvant therapies including immunotherapy. The results of the study revealed the complex impact of lactate metabolism in LUSC and presented a novel approach to assess patient prognosis and guide individualized adjuvant therapy.
2. Materials and methods
2.1. Dataset collection and preprocessing
The detailed analysis process and analysis tools for this study are shown in Fig. 1. All abbreviations mentioned in this article are shown in Supplementary Table 1.
Fig. 1.

The flowchart of the study design.
In this study, we used the RNA-seq data of LUSC patients (n = 502) from the TCGA GDC database (portal.gdc.cancer.gov) and their matched clinical phenotype data as a training cohort. Meanwhile, we obtained transcriptome data and survival data from the Gene Expression Omnibus (GEO) database (https://www.ncbi.nlm.nih.gov/geo) for the GSE157009 cohort [18] as an independent validation cohort. Detailed baseline clinical phenotype information for the TCGA cohort of patients with LUSC is summarized in Supplementary Table 2.
The TCGA-LUSC simple nucleotide variation (SNV) data (Masked Somatic Mutation proceed by VarScan) and copy number variation (CNV) data (Masked Copy Number Segment) were obtained from TCGA GDC. To better perceive CNV data, we performed GISTIC2.0 [19] analysis through GenePattern (https://www.genepattern.org).
The preannotated gene sets used in the study were obtained from the Molecular Signatures Database (MsigDB, https://www.gsea-msigdb.org/gsea/msigdb). By searching and filtering with “lactate” as the keyword, we included 6 lactate metabolism-related gene sets (GOBP lactate transmembrane transport, GOMF lactate transmembrane transporter activity, GOMF lactate dehydrogenase activity, HP elevated lactate pyruvate ratio, HP increased circulating lactate dehydrogenase concentration, HP increased serum lactate) and obtained 248 LMRGs by merging and de-duplication of these genes (Supplementary Table 3).
2.2. Non-negative matrix factorization (NMF) partition the sample
Univariate Cox regression analysis was performed in LMRGs based on the TCGA cohort to screen for trait genes related to LUSC prognosis. Each trait gene was examined using Kaplan-Meier (K-M) survival analysis.
Based on the expression profile of the traits LMRG, NMF was performed using the NMF package in R [20] to achieve unsupervised clustering of patients into clusters with different expression patterns of LMRG. In the NMF clustering process, a random seed is set, the rank value is set from 1 to 10, the method is selected as “brunet”, and the number of iterations is set to 10. The optimal rank value is determined from the variation curve of the cophenetic correlation coefficient and the residual sum of squares (rss) with factorization rank.
2.3. Crosstalk analysis of lactate metabolism and immune infiltration
With the GSVA package in R [21], gene set variation analysis (GSVA) was performed based on four gene sets of biological processes related to lactate metabolism for all samples of multiple clusters. Based on the gene set of 28 immune cells in NSCLC obtained by integrating multidimensional immune-related information through machine learning [22], the immune cell infiltration analysis was performed using GSVA. Tumor purity, immune score, and stromal score in tumor tissues were calculated using the ESTIMATE package in R using the estimation of stromal and immune cells in malignant tumor tissues using the expression data (ESTIMATE) algorithm [23]. Through a comprehensive evaluation and comparison of lactate metabolism and immunogenomics, the clusters were finally merged with the criteria of lactate metabolism levels and the LUSC lactate metabolism-low (LML) / high (LMH) subtypes were identified.
2.4. Genetic polymorphism analysis
The Maftools package in R [24] was used to analyze and visualize the somatic mutation data for two subtypes. From the COSMIC website (cancer.sanger.ac.uk/signatures), we obtained 30 mutational signatures that were broadly verified and had explicit biological implications. 96 mutation spectra were obtained for each sample through the DeconstructSigs package in R [25] and the fraction of 30 signatures was calculated.
For genomic structural variation, we analyzed the CNV data of the two subtypes. We firstly extracted the copy number of the trait LMRGs to analyze the genomic structural differences associated with lactate metabolism. Subsequently, the CNV data were converted into chromosome arms and local alterations through GISTIC2.0 analysis [19].
2.5. DEGs between subtypes and functional enrichment analysis
Using the DESeq2 package in R [26], a differential expression analysis was performed on the RNA-seq counts data of both subtypes in the TCGA cohort. Genes with an adjust p value < 0.05 and |log2FoldChange| > 1 were considered differentially expressed genes (DEGs). Gene Ontology (GO) and Kyoto Encyclopedia of Genes and Genomes (KEGG) enrichment analysis were performed for DEGs. Also, based on the expression profiles, gene set enrichment analysis (GSEA) was performed through the clusterProfiler package in R [27] using the curated gene set retrieved from MsigDB, adjusted p value < 0.05 for the phenotype was considered statistically significant.
2.6. Identification of hub genes related to lactate metabolism
Weight gene co-expression network analysis (WGCNA) was performed through the WGCNA package in R [28] to obtain the most highly correlated co-expressed gene modules in DEGs with differentiation of two subtypes. First, setting the cut height to 60, we detected and excluded outliers through sample clustering. The transformation of the adjacency matrix was completed by setting the optimal soft threshold of the scale-free network, and the topological overlap matrix (TOM) was obtained. Subsequently, minimum number of genes in per module was set to 25, and the obtained co-expressed gene modules by dynamic shearing tree and the similar modules were merged. Finally, through the correlation heatmap of modules and subtypes, genes within the module with the highest absolute value of correlation with the two subtypes were identified as hub genes related to lactate metabolism.
2.7. Construction and validation of LMRPI
Based on the TCGA-LUSC cohort, univariate Cox regression analysis was performed on the hub genes to obtain independent prognostic factors. Subsequently, LMRPI, a risk proportional model was developed by multivariate Cox stepwise regression analysis. Model scores were obtained by summing the products of each variable and coefficient, and patients were classified into LMRPI-low and LMRPI-high subgroups based on the median values. K-M analysis and time-dependent receiver operating characteristic (ROC) analysis were used to assess the prognostic efficacy of LMRPI in the TCGA cohort and the GEO cohort. The independent prognostic capacity of LMRPI was verified by univariate and multivariate Cox regression analysis.
Based on the information of TCGA-LUSC patients, differences in the distribution of multiple clinical phenotypes between two subgroups were examined using the chi-square test. A clinical nomogram using LMRPI and clinical characteristics based on the coefficients of Cox regression was established to predict the overall survival (OS) of patients at 1, 3 and 5 years. Subsequently, the clinical applicability of the nomogram was examined by calibration curve, ROC analysis, and decision curve analysis (DCA).
2.8. Immune infiltration and genetic characteristic
The expression data of all samples were deconvoluted using the CIBERSORTx algorithm [29] to calculate the composition of 22 immune cell infiltrations. Wilcoxon rank sum test was used to compare differences in the fraction of immune cells of each of the two subgroups. Using the Maftools package, oncoplot was plotted to show the top 20 genes with the highest mutation frequencies in both subgroups and their mutation types, and the tumor mutation burden (TMB) and nucleotide changes for each individual sample were also shown.
2.9. Evaluation of the efficacy of multiple therapies
Multidimensional analysis and multiple validation analysis were used to more accurately assess the efficacy of ICI therapies in two subgroups. Differences between the two subgroups for widely acknowledged biomarkers or potential targets in various ICI therapies were analyzed. To predict the sensitivity to ICI therapy in patients with LUSC, tumor immune dysfunction and exclusion (TIDE) scores [30] and immunephenoscore (IPS) score [31] were compared between two subgroups. TIDE scores were calculated based on TCGA-LUSC expression profiles online (https://tide.dfci.harvard.edu/), and IPS scores were obtained from The Cancer Immunome Atlas (TCIA; https://tcia.at/).
For the comparison of the sensitivity of the two subgroups to the chemotherapeutic and targeted drugs typically adopted in the course of LUSC treatment, we opted for the pRRophetic package in R [32], which is based on the Genomics of Drug Sensitivity in Cancer (GDSC) database to derive the inhibition concentration 50 (IC50) of antitumor compounds.
2.10. Statistical analysis
R software (version 4.1.1; https://www.r-project.org/) and its corresponding R packages were used for statistical analysis and graph production. A p value < 0.05 was considered statistically significant. Log-rank test was used to compare the K-M curves between two groups. Wilcoxon rank sum test was used to analyze the differences in continuous variables between two groups. The Kruskal-Wallis test was used to compare the differences in continuous variables between multiple groups. The chi-square test was used to analyze the differences in graded variables between two groups.
3. Results
3.1. Unsupervised clustering based on trait LMRGS
By univariate Cox analysis, we obtained 14 trait LMRGs (7 protective factors, 7 risk factors) that were significantly associated with prognosis (Fig. 2A), and the validation results of the K-M analysis for each gene were consistent (Fig. S1). The rank value in NMF can be 3 or 4 based on two criteria: the front point of the largest decline in the cophenetic curve (Fig. 2B) and the first inflection point of the rss curve (Fig. 2C). However, the clustering results are more biologically significant when the rank value is 3, so 3 was chosen as the number of clusters. Based on the expression profiles of the trait LMRGS, the samples of TCGA-LUSC were classified into three clusters, including cluster 1 (n = 106), cluster 2 (n = 241), and cluster 3 (n = 148) by unsupervised clustering (Fig. 2D).
Fig. 2.

Non-negative matrix factorization (NMF) clustering based on trait lactate metabolism-related genes (LMRGs). (A) Univariate Cox analysis of LMRGs. (B) The cophenetic curve of NMF clustering at rank = 2 to 10. (C) The residual sum of squares (rss) curve of NMF clustering at rank = 2 to 10. (D) NMF clustering matrix at rank = 3.
3.2. Lactate metabolic subtypes in LUSC
To understand the interactions between lactate metabolism and immune infiltration, the GSVA analysis based on the gene sets of lactate metabolism and immune cell infiltration, ESTIMATE analysis and cytolytic activity (CYT) analysis were implemented in the three clusters. Heatmap shows the enrichment scores of biological processes related to lactate metabolism, CYT score, ESTIMATE analysis score (Tumor Purity, ESTIMATE score, Immune Score, Stromal Score) and Immune cell infiltration score for each sample in the three clusters (Fig. 3A). The enrichment scores of the “increased serum lactate” and “elevated lactate pyruvate ratio” gene sets in Cluster 2 were significantly higher than the other two clusters, while the “lactate transmembrane transporter activity” gene set in Cluster 1 had a high enrichment score (Fig. 3B). The high concentration of lactate laid the basis for its reflection of the degree of tumor metabolic reprogramming and its role as a signaling molecule to inhibit antitumor immunity [13]. Besides, the higher lactate pyruvate ratio precisely reflected the fact that lactate has become the main carbon source of the TCA cycle in the energy metabolism of tumor cells [15]. Therefore, among the three clusters, cluster 2 was considered to have the highest level of lactate metabolism, while cluster 1 had a higher lactate transmembrane transporter protein activity.
Fig. 3.

Lactate metabolism and immunogenomic characterization of three clusters in lung squamous carcinoma (LUSC). (A) The heatmap shows the Lactate metabolism enrichment scores, Clusters, ESTIMATE scores (Tumor Purity, ESTIMATE Score, Immune Score, Stromal Score), CYT scores, and immune cell infiltration from top to bottom, and different colors according to the figure annotations represent the scores of different entries of each sample respectively. (B) Gene set variation analysis (GSVA) scores of lactate metabolism-related biological functions in different LUSC clusters. (C) Estimation of stromal and immune cells in malignant tumor tissues using expression data (ESTIMATE) scores in three clusters. (D) Cytolytic activity (CYT) scores in three clusters. (E) GSVA scores of tumor microenvironment TME immune cells in three clusters. The scattered dots represent the scores. The thick lines represent the median value. The bottom and top of the boxes are the 25th and 75th percentiles, respectively. Wilcoxon test was performed to assessed significant statistical differences between clusters (ns, not significant; *, P < 0.05; **, P < 0.01; ***, P < 0.001).
In the ESTIMATE analysis, from cluster 1, cluster 3 to cluster 2, the stromal component of the tumor and the degree of immune infiltration decreased, while the purity of the tumor increased (Fig. 3C). The CYT score, which reflects the cytolytic activity of immune cells in tumors, was significantly lower in cluster 2 than in the other two clusters (Fig. 3D). Cluster 2 had the lowest enrichment scores for the eight classical antitumor immune cells, while cluster 1 had the highest enrichment levels except for activated CD4 cells and activated CD8 cells (Fig. 3E).
Based on cross-talk analysis of lactate metabolism and immunogenomics, we identified the characteristics of three clusters. Cluster 2 had the highest level of lactate metabolism and was the cold tumor with the lowest level of immune infiltration; cluster 1 and cluster 3 both had lower levels of lactate metabolism activity, but were, respectively, hot and cold tumors. Finally, cluster 2 was identified as the as LMH subtype while cluster 1 and cluster 3 were merged as LML subtype based on the level of lactate metabolism.
3.3. Somatic mutations and genetic structural polymorphisms in two subtypes
As shown in the mutation summary plots of the two subtypes (Fig. S2A, B), the two subtypes shared a similar pattern of somatic mutation and nucleotide alterations, but the LMH subtype had a higher mutation frequency. Both subtypes were dominated by the Missense mutation, C > T mutation and C > A mutation, which accounted for the majority, and TTN and TP53 had a mutation rate of>60 % in two subtypes. Among the 30 mutant signatures, Signature 3 (which was associated with the failure of DNA double-strand break repair by homologous recombination) and Signature 4 (which due to tobacco mutagens) had high scores (mean value > 0.1) in both subtypes (Fig. 4A, B; Fig. S3).
Fig. 4.

Somatic mutations and copy number variation (CNV) characteristics of two lung squamous cell (LUSC) subtypes. (A) COSMIC 30 mutational signatures scores and clinical phenotype of lactate metabolism low (LML) subtypes. (B) COSMIC 30 mutational signatures scores and clinical phenotype of lactate metabolism high (LMH) subtypes. (C) Location of 14 trait lactate metabolism-related genes (LMRGs) on 23 chromosomes and CNV variations in both two subtypes. (D) CNV of 14 trait LMRGs in LML subtype. (E) CNV of 14 trait LMRGs in LMH subtype. (F) G-Scores of chromosome fragments in GISTIC2.0 analysis of LML subtypes. (G) G-Scores of chromosome fragments in GISTIC2.0 analysis of LMH subtypes.
The trait LMRGs had similar CNV patterns in the two subtypes (Fig. 4C), but their gain copy and loss copy levels are significantly different (Fig. 4D, E). The results of GISTIC2.0 analysis showed that chromosome 11q13.3 in the LML subtype tended to gain copy, while 3q26.31 and 3q28 in the LMH subtype tended to gain copy (Fig. 4F, G).
3.4. Differential expression profiles and biological functions of two subtypes
In the differential expression analysis of two subtypes, we obtained 917 DEGs, 24 genes up-regulated, and 893 genes down-regulated in the LMH subtype (Fig. S4A). GO enrichment analysis revealed that in addition to organic hydroxy compound transport and catabolic process, carboxylic acid transport and other organic metabolic processes, DEGs were mainly enriched in biological processes related to immune function such as humoral immune response, cell chemotaxis, leukocyte, leukocyte migration, immune receptor activity (Fig. 5A). KEGG enrichment analysis showed that DEGs were highly enriched in pathways such as cell adhesion molecules and focal adhesion, and adhesion molecules played an important role in tumor metastasis and colonization (Fig. 5B). At the same time, the high enrichment of the cytokine-cytokine receptor interaction pathway also implies a strong connection between DEGs and the immune system.
Fig. 5.

Functional enrichment analysis of two LUSC subtypes. (A) Gene Ontology (GO) enrichment analysis of differentially expressed genes (DEGs) between two LUSC subtypes. (B) Kyoto Encyclopedia of Genes and Genomes (KEGG) enrichment analysis of DEGs between two LUSC subtypes. (C) Gene sets enriched in lactate metabolism high (LMH) subtype. (D) Gene sets enriched in lactate metabolism low (LML) subtype.
In GSEA analysis, the LMH subtype was more enriched in the TCA cycle, respiratory electron transport, mitochondrial function, and other sets of genes related to aerobic oxidative metabolism, while LML was more enriched in the pathways related to immune response (Fig. 5C, D). The results of GSEA analysis reveal that higher levels of lactate metabolism may reflect the metabolic adaptation of the tumor, while low levels of lactate metabolism are associated with a better tumor immune environment. Surprisingly, the LMH and LML subtypes were respectively enriched in the hypoxia up and hypoxia low gene sets, which was consistent with the basic study [33], [34] and confirmed the fact that hypoxia is inextricably linked to lactate metabolism levels from a bioinformatics perspective.
3.5. Lactate metabolism-related co-expression hub genes
To obtain hub genes for differences between subtypes with different levels of lactate metabolism, a WGCNA analysis was performed based on DEGs of two subtypes. After eliminating 5 outlier samples and setting the power value to the optimal soft threshold 3, we identified 5 co-expression modules based on the dynamic shear tree (Fig. 6A-C). The turquoise module had the largest absolute value of correlation with the distinction of the two subtypes (Fig. 6D); therefore, 389 genes in the turquoise module were identified as genes related to the lactate metabolism, and the gene co-expression network with a threshold>0.3 was visualized (Fig. 6E).
Fig. 6.

Weighted gene co-expression network analysis (WGCNA) identified lactate metabolism-related hub genes. (A) Five outliers were cut by setting the cut height at 60. (B) Determine the optimal soft threshold of WGCNA by scale independence and average connectivity. (C) Dendrogram and module colors of genes in WGCNA process. (D) Four non-gray modules were obtained through WGCNA. (E) The network of the genes in the turquoise module (weight of edge > 0.3).
3.6. Construction and validation of LMRPI
Based on the TCGA-LUSC cohort, we performed a univariate Cox analysis on hub genes and obtained 69 prognostic associated factors (Fig. S4B). Based on prognostic genes, using Cox stepwise regression analysis, we developed a Cox proportional hazards prognostic model called LMRPI. Based on the median value of the LMRPI score, we divided LUSC patients into LMRPI-low and LMRPI-high subgroups.
In the TCGA cohort, the correspondence between the LMRPI score and OS of the patient has been shown in Fig. 7A, and the LMRPI-high subgroup had a poorer prognosis compared to LMRPI-low subgroup (Fig. 7B). The AUC value in the time-dependent ROC was 1,2,3 at one year, two years, and three years (Fig. 7C). The survival results of the patients of the two subtypes in the GEO validation cohort were consistent with the training cohort (Fig. 7D-F). Age, stage, and LMRPI were shown to be prognostic correlates by univariate Cox analysis of LMRPI and common clinical phenotypes (Fig. 7G). After excluding covariance between the three variables using multivariate Cox analysis, the excellent independent prognostic power of LMRPI was demonstrated (Fig. 7H).
Fig. 7.

Construction and validation of lactate metabolism-related prognosis index (LMRPI). (A) LMRPI score and survival information of lung squamous carcinoma (LUSC) patients in The Cancer Genome Atlas (TCGA) cohort. (B) Kaplan-Meier (K-M) survival curves for two LMRPI subgroups in the TCGA cohort. (C) 1-year, 2-years, and 3-years receiver operating characteristic (ROC) curves and their area under the curve (AUC) of LMRPI in TCGA cohort. (D) LMRPI score and survival information of LUSC patients in Gene Expression Omnibus (GEO) cohort. (E) K-M survival curves for two LMRPI subgroups in the GEO cohort. (F) 1-year, 2-years, and 3-years ROC curves and their AUC of LMRPI in GEO cohort. (G) Univariate Cox analysis to validate the independent prognostic ability of LMRPI. (H) Multivariate Cox analysis to validate the independent prognostic ability of LMRPI.
3.7. Clinical phenotypic characteristics of LMRPI
There was no significant difference in the age distribution between the two subgroups (Fig. 8A), but in gender distribution, a higher proportion of female patients and a lower proportion of male patients in the LMRPI-high subgroup suggested that female LUSC patients may have a worse survival expectation (Fig. 8B). Meanwhile, a higher proportion of LMRPI-high patients had stage I (Fig. 8C). Lower staging usually tends to predict a better prognosis [35], but specific results may indicate that a high LMRPI score is associated with a worse survival outcome even if the patient has a lower stage. Finally, according to the study by Thorsson et al. on immune characteristics of TCGA data [36], the distribution of LMRPI-high and LMRPI-low subgroups of was investigated (Fig. 8D). Compared to the LMRPI-low subgroup, the LMRPI-high subgroup contained more C3 and C6 subtypes. The C3 subtype was characterized by elevated expression of Th17 and Th1 with a lower frequency of aneuploidy levels and copy number changes, while the C6 subtype was characterized by high expression of TGF-β signature and was associated with the worst prognosis.
Fig. 8.

Distribution of clinical phenotypes in two lactate metabolism-related prognostic index (LMRPI) subgroups. (A) Heatmap and table showing the distribution of lung squamous carcinoma (LUSC) patients by age (<65 and ≥ 65) between two LMRPI subgroups. (B) Heatmap and table showing the distribution of LUSC patients by gender (female and male) between two LMRPI subgroups. (C) Heatmap and table showing the distribution of LUSC patients by clinical stage (stage I, stage II, stage III, and stage IV) between two LMRPI subgroups. (D) Heatmap and table showing the distribution of LUSC patients by immune subtypes (C1, C2, C3, C4, and C6) between two LMRPI subgroups.
3.8. Development of clinical nomogram
To better predict OS in LUSC patients, we developed a nomogram based on clinical phenotype and LMRPI (Fig. 9A). In the nomogram, the median survival rates of LUSC patients at 1, 3, and 5 years were 0.863,0.633, and 0.506, respectively. The calibration graph of the nomogram showed high consistency between the prognostic prediction and the true survival outcome of the patients (Fig. 9B). The AUC values of the ROC curves at 1, 3, and 5 years were 0.715, 0.709 and 0.691, respectively (Fig. 9C-E), which were superior to the independent predictive power of LMRPI and other clinical factors. The DCA curves at 1, 3, and 5 years also confirmed the better benefit of the nomogram in clinical decision making (Fig. 9F-H). These findings showed that the nomogram has a high predictive efficacy in LUSC patients and has a promising clinical application.
Fig. 9.

Development and examination of clinical nomogram. (A) Clinical nomogram was established based on clinical characteristics and lactate metabolism-related prognosis index (LMRPI) to predict the survival rate of patients at 1-year, 3-years, and 5 years. (B) The calibration plot of clinical nomogram at 1-year, 3-years, and 5 years. (C-E) 1-year (C), 3-years (D), and 5-years (E) receiver operating characteristic (ROC) curves and their area under the curve (AUC) of nomogram, LMRPI, and clinical characteristics. (F-H) 1-year (F), 3-years (G), and 5-years (H) decision curve analysis (DCA) of nomogram, LMRPI, and clinical characteristics.
3.9. Immune infiltration and somatic mutation characteristics of two subgroups
We obtained immune cell infiltration fractions using CIBERSORTx to deconvolute samples from both subgroups (Fig. 10A). The LMRPI-low subgroup had more resting natural killer (NK) cells, M1 macrophages and activated mast cells, while the LMRPI-high subgroup had more naive CD4 T cells, monocytes, M2 macrophages, resting mast cells, neutrophils (Fig. 10B). The two main macrophage subclasses, m1 and m2, were found to be significantly different in two subgroups of LMRPI. M1 macrophages, which were highly expressed in the LMRPI-low subgroup, played an important role in initiating inflammatory and antitumor responses in TME [37]. In contrast, M2 macrophages, which were more abundant in the LMRPI-high subgroup, were converted from M1 macrophages by the action of factors released in TME and were characterized by anti-inflammatory, profibrotic, proangiogenic, and immunosuppressive effects [38]. Based on the above, it could be inferred that the two subgroups might have quite different immune environments.
Fig. 10.

Immune infiltration and somatic mutation characteristics of lactate metabolism-related prognosis index (LMRPI). (A) The relative percent of 22 immune cells in The Cancer Genome Atlas (TCGA) cohort of two LMRPI subgroups. (B) The different fractions of immune cells in two LMRPI subgroups. The scattered dots represent the immune cell fraction. The thick lines represent the median value. The bottom and top of the boxes are the 25 and 75 percentiles, respectively. “*” is used to represent significant statistical differences between the two subgroups (*, P < 0.05; **, P < 0.01; ***, P < 0.001). (C) Oncoplot shows the mutation types and nucleotide changes in the 20 genes with the highest mutation frequencies in the two LMRPI subgroups and the tumor mutation burden (TMB).
We presented the somatic mutation information of two subgroups using oncoplot (Fig. 10C). In particular, the LMRPI-low subgroup of patients had a high frequency of CSMD3 mutations (42 %), while the high mutation rate of CSMD3 was considered to be associated with a better prognosis in patients with LUSC in a previous clinical study [39].
3.10. Treatment efficacy of LMRPI subgroups
The regulation between TME and immune cells and the production of neoantigens by tumors themselves are the main factors influencing the efficacy of ICI therapy [40]. In the analysis that examined the differences in the biomarker and potential targets of ICI in two subgroups, we found that TMB, which was directly associated with neoantigen production and the target PD-L1, was not significantly different between the two subgroups, while the expression of CTLA4, CD28, ICOS and PD-1 was significantly elevated in the LMRPI-high subgroup (Fig. 11A-F). High expression of CTLA-4 was a classic indicator of the effectiveness of anti-CTLA-4 therapies, and ICOS was is also important in response to anti-CTLA-4 therapy, and therapies to stimulate ICOS checkpoints were also being developed [41]. To some extent, PD-1 expression in tumor bulk data also reflects the expression of PD-1 on the surface of infiltrating T cells in TME. Recently, CD28 was found to be required for effective anti-PD-1 therapy, and studies have reported that targeting CD28 bispecific antibodies could enhance the efficacy of anti-PD-1 therapy [42], [43]. TIDE analysis showed that the LMRPI-high subgroup had a higher dysfunction score, which predicted immune cell dysfunction in their TME, while the exclusion score was not significantly different (Fig. 11G, H). The IPS scores of CTLA-4 positive PD-1 negative and CTLA4 positive PD-1 positive were significantly higher in the LMRPI-high subgroup (Fig. 11I). Based on the combined results, the LMRPI-high subgroup tended to have a better response and efficacy in anti-CTLA-4 and anti-PD-1 therapies, and had a higher expression of ICOS and CD28, which are two potential targets to promote the efficacy of existing therapies.
Fig. 11.

Treatment efficacy of two lactate metabolism-related prognosis index (LMRPI) subgroups. (A) Tumor mutation burden of two subgroups. (B) CTLA-4 expression of two subgroups. (C) CD28 expression of two subgroups. (D) ICOS expression of two subgroups. (E) PD-1 expression of two subgroups. (F) PD-L1 expression of two subgroups. (G) T cell dysfunction score of two subgroups. (H) T cell exclusion score of two subgroups. (I) immunephenoscore (IPS) score of two subgroups. (J) Inhibition concentration 50 (IC50) for different chemotherapeutic and molecularly targeted therapeutic agents of two subgroups.
In the analysis of the sensitivity of chemotherapy and molecular targeted therapy drugs (Fig. 11J), the LMRPI-high subgroup had a higher sensitivity to two chemotherapy drugs, cytarabine, vinblastine, while the LMRPI-low subgroup had a higher sensitivity to paclitaxel, gemcitabine, epothilone.B, docetaxel.B, docetaxel, etoposide, and vinorelbine, which could be helpful for different chemotherapeutic strategies during the treatment of patients in two subgroups. Meanwhile, the LMRPI low subgroup had a higher sensitivity to two targeted drugs, erlotinib and afatinib, suggesting that patients in the LMRPI-low subgroup may have a better benefit for molecular targeted therapies.
4. Discussion
LUSC accounts for approximately 30 % of lung cancers and is poor responsive to multiple adjuvant therapies, including molecularly targeted therapies [4]. However, ICI therapies have produced exciting results in the treatment of LUSC, and several drugs have been approved by the FDA for immunotherapy of LUSC [5], [6]. Tumor cell heterogeneity and complex variations in TME are the major causes of drug resistance in NSCLC, of which metabolic reprogramming and immune microenvironment are two important constituents [7]. Lactate produced by tumor aerobic glycolysis has a broad impact on energy metabolism of tumors and on the composition and function of immune cells in TME [15]. Therefore, there is an intrinsic demand for cross-talk analysis of tumor lactate metabolism and immune environment to differentiate the heterogeneity of LUSC, assess patient prognosis, and predict the efficacy of multiple therapies including immunotherapy.
Undergoing metabolic reprogramming, lactate is secreted in large amounts during aerobic glycolysis in tumors, and high concentrations of lactate have been proved to be associated with cancer aggressiveness and low survival [44], [45]. At the same time, the dual-compartment metabolic coupling pattern formed in tumors with upregulated secretion of lactate by aerobic glycolysis in hypoxic regions and uptake of lactate for TCA cycling in relatively oxygen-rich regions provides for energy metabolism in tumors [10], [11], [12], [13]. Based on the expression profiles of prognosis-related LMRGs, we found two subtypes of LUSC with different levels of lactate metabolism, and the crosstalk between lactate metabolism and immunogenomics determined the distinct characteristics of the disease. The samples of the LMH subtype had high lactate metabolism levels, high tumor purity, and low stromal and immune composition, while the samples of the LML subtype were the opposite. Apparently, the immune environment between the two subtypes was not just different in the quantity of immune cells. Thus, we additionally assessed the cytolytic activity of the two subtypes by CYT score. The CYT score is a quantitative measure of transcript levels based on granzyme A (GZMA) and perforin (PRF1), representing the antitumor cytolytic activity of cytotoxic T cells (CTL) and NK cells in TME [46]. Consistent with the results of the basic research [12], [13], [17], we found that higher levels of lactate metabolism had a significant negative effect on the quantity and quality of antitumor immune cells and that there was a significantly suppressed tumor microenvironment in the samples of high lactate metabolism.
Metabolic reprogramming of tumors is a process in which tumors autonomously alter their metabolic patterns through various metabolic pathways to meet their increasing demands for energy and substance synthesis and to reduce oxidative stress during their extensive proliferation [47]. In functional analysis, the LMH subtype exhibits diverse relevance to the energy metabolic links of tumor cells, which are closely related to multiple biological processes of aerobic oxidation. The enrichment of LMH and LML subtypes in the hypoxia up and hypoxia down pathways also reflects the response of tumor cells to hypoxia and adaptation to TME in lactate metabolism-high tumors. Such results provide us with the hypothesis that lactate metabolism levels may have potential as an indicator of the extent of tumor metabolic reprogramming. Therapies targeting tumor metabolism have been extensively studied, and lactate, as a key molecule in aerobic glycolysis, is also an important target, and there have already been drugs targeting lactate metabolism under development [48], [49], [50], [51]. Our study also reflects from a bioinformatic perspective that targeted lactate metabolic therapy may have a multifaceted benefit in LUSC patients and that the high level of tumor metabolic reprogramming and the low degree of immune infiltration associated with lactate metabolic levels in LMH subtypes may be improved by targeted lactate therapy.
The two LUSC subtypes were composed of three clusters identified by NMF. LMH was composed of cluster 2 with the highest level of lactate metabolism and the lowest level of immune infiltration, while the LML subtype was composed of clusters 1 and 3 with low levels of lactate metabolism, and we found that the two clusters had different immune microenvironments. Cluster 1 exhibited a richer degree of immune infiltration, more stromal components, and lower tumor purity than cluster 3indicatingthat there were potential factors that could further subdivide patients’ characteristics in LUSC according to the levels of lactate metabolism. In future studies, we will further investigate the phenotypic factors that interact strongly with lactate metabolism to refine the subtypes and establish a comprehensive LUSC typing system to assess metabolic and immunological characteristics.
In our study, we developed a prognostic model LMRPI based on the hub genes differentially expressed in the two subtypes, and subsequently classified patients into LMRPI-low subgroup and LMRPI-high subgroup according to the median value of index. Based on two independent cohorts of TCGA and GEO, we tested the excellent predictive efficacy of LMRPI by K-M survival analysis and time-dependent ROC analysis, and identified it as an independent prognostic factor by univariate and multivariate Cox regression analysis. To better utilize clinical information to determine the prognosis of patients, we established a clinical nomogram based on six clinical phenotypes and LMRPI, and confirmed its reliability in clinical application using calibration curve, time-dependent ROC analysis, and DCA analysis. The results showed that the nomogram had a potential in accurately predicting the short-term (1 year) and long-term (5 years) prognosis of LUSC patients which is a valuable guideline for clinical decision.
ICI therapies have proven excellent efficacy in tumors, but the low response rate leads to a high dependence on the predictive biomarker. In our analysis, higher levels of CTLA-4, CD28, ICOS, and PD-1 transcripts in the LMRPI-high subgroup implied high responsiveness to anti-CTLA-4 and anti-PD-1 therapies, as well as a good response to potential targets of ICI. Furthermore, by GDSC analysis of patients' IC50 for antitumor drugs, we found that the two subtypes also had different sensitivities to various chemotherapeutic agents and molecularly targeted drugs. Based on the the above, we recommend two ICIs, anti-CTLA-4 and anti-PD-1, as well as cytarabine- and vinblastine-based chemotherapy for patients in the LMRPI-high subgroup for adjuvant therapy. For the LMRPI-low subgroup, the high sensitivity to erlotinib and afatinib suggests a higher benefit of molecularly targeted therapy. Furthermore, chemotherapy regimens based on paclitaxel, gemcitabine, epothilone. B, docetaxel, vinorelbine are more suitable for the LMRPI-low subgroup.
Although our study has a comprehensive analytical process, there were still several limitations. First, to elucidate the mechanisms underlying the complex effects of lactate metabolism on the biological functions of LUSC in our study, robust functional experiments need to be considered. Second, as a retrospective analysis based on public databases, prospective studies will be necessary to be carried out in future to investigate the mechanisms involved in lactate metabolism and to assess the predictive efficacy of LMRPI.
In conclusion, we first identified 14 prognostic-related trait LMRGs in LUSC, divided LUSC patients into three distinct clusters, and formed two subtypes, LMH and LML, based on lactate metabolism levels. The two subtypes showed distinct metabolic patterns, an immune microenvironment, and biological characteristics, providing important information to explore the mechanisms of lactate metabolism in LUSC. Meanwhile, we established a prognostic index for LUSC based on differentially expressed hub genes of the two subtypes, which was able to predict the responsiveness of patients to immunotherapy, chemotherapy, and molecular targeted therapy, and had a potential in guiding physicians to implement individualized adjuvant therapy for patients with LUSC.
CRediT authorship contribution statement
Chenghao Wang: Methodology, Formal analysis, Investigation. Tong Lu: Visualization. Ran Xu: Writing – original draft, Writing – review & editing. Shan Luo: Resources. Jiaying Zhao: Validation. Linyou Zhang: Conceptualization, Supervision.
Declaration of Competing Interest
The authors declare that they have no known competing financial interests or personal relationships that could have appeared to influence the work reported in this paper.
Footnotes
Supplementary data to this article can be found online at https://doi.org/10.1016/j.csbj.2022.08.067.
Contributor Information
Jiaying Zhao, Email: Jiayingz8912@126.com.
Linyou Zhang, Email: lyzhang@hrbmu.edu.cn.
Appendix A. Supplementary data
The following are the Supplementary data to this article:
Supplementary figure 1.

Supplementary figure 2.

Supplementary figure 3.

Supplementary figure 4.

References
- 1.Siegel R.L., Miller K.D., Fuchs H.E., Jemal A. Cancer statistics, 2022. CA Cancer J Clin. 2022;72(1):7–33. doi: 10.3322/caac.21708. [DOI] [PubMed] [Google Scholar]
- 2.Langer C.J., Obasaju C., Bunn P., Bonomi P., Gandara D., Hirsch F.R., et al. Incremental Innovation and Progress in Advanced Squamous Cell Lung Cancer: Current Status and Future Impact of Treatment. J Thorac Oncol. 2016;11(12):2066–2081. doi: 10.1016/j.jtho.2016.08.138. [DOI] [PubMed] [Google Scholar]
- 3.Asmis T.R., Ding K., Seymour L., Shepherd F.A., Leighl N.B., Winton T.L., et al. Age and comorbidity as independent prognostic factors in the treatment of non small-cell lung cancer: a review of National Cancer Institute of Canada Clinical Trials Group trials. J Clin Oncol. 2008;26(1):54–59. doi: 10.1200/JCO.2007.12.8322. [DOI] [PubMed] [Google Scholar]
- 4.Bonomi P.D., Gandara D., Hirsch F.R., Kerr K.M., Obasaju C., Paz-Ares L., et al. Predictive biomarkers for response to EGFR-directed monoclonal antibodies for advanced squamous cell lung cancer. Ann Oncol. 2018;29(8):1701–1709. doi: 10.1093/annonc/mdy196. [DOI] [PMC free article] [PubMed] [Google Scholar]
- 5.Herbst R.S., Baas P., Kim D.-W., Felip E., Pérez-Gracia J.L., Han J.-Y., et al. Pembrolizumab versus docetaxel for previously treated, PD-L1-positive, advanced non-small-cell lung cancer (KEYNOTE-010): a randomised controlled trial. Lancet. 2016;387(10027):1540–1550. doi: 10.1016/S0140-6736(15)01281-7. [DOI] [PubMed] [Google Scholar]
- 6.Brahmer J., Reckamp K.L., Baas P., Crino L., Eberhardt W.E., Poddubskaya E., et al. Nivolumab versus Docetaxel in Advanced Squamous-Cell Non-Small-Cell Lung Cancer. N Engl J Med. 2015;373(2):123–135. doi: 10.1056/NEJMoa1504627. [DOI] [PMC free article] [PubMed] [Google Scholar]
- 7.Marusyk A., Janiszewska M., Polyak K. Intratumor Heterogeneity: The Rosetta Stone of Therapy Resistance. Cancer Cell. 2020;37(4):471–484. doi: 10.1016/j.ccell.2020.03.007. [DOI] [PMC free article] [PubMed] [Google Scholar]
- 8.Hanahan D. Hallmarks of Cancer: New Dimensions. Cancer Discov. 2022;12(1):31–46. doi: 10.1158/2159-8290.CD-21-1059. [DOI] [PubMed] [Google Scholar]
- 9.Hensley C.T., Faubert B., Yuan Q., Lev-Cohain N., Jin E., Kim J., et al. Metabolic Heterogeneity in Human Lung Tumors. Cell. 2016;164(4):681–694. doi: 10.1016/j.cell.2015.12.034. [DOI] [PMC free article] [PubMed] [Google Scholar]
- 10.Pavlides S., Whitaker-Menezes D., Castello-Cros R., Flomenberg N., Witkiewicz A.K., Frank P.G., et al. The reverse Warburg effect: aerobic glycolysis in cancer associated fibroblasts and the tumor stroma. Cell Cycle. 2009;8(23):3984–4001. doi: 10.4161/cc.8.23.10238. [DOI] [PubMed] [Google Scholar]
- 11.Chang C.H., Qiu J., O'Sullivan D., Buck M.D., Noguchi T., Curtis J.D., et al. Metabolic Competition in the Tumor Microenvironment Is a Driver of Cancer Progression. Cell. 2015;162(6):1229–1241. doi: 10.1016/j.cell.2015.08.016. [DOI] [PMC free article] [PubMed] [Google Scholar]
- 12.Haas R., Smith J., Rocher-Ros V., Nadkarni S., Montero-Melendez T., D'Acquisto F., et al. Lactate Regulates Metabolic and Pro-inflammatory Circuits in Control of T Cell Migration and Effector Functions. PLoS Biol. 2015;13(7):e1002202. doi: 10.1371/journal.pbio.1002202. [DOI] [PMC free article] [PubMed] [Google Scholar]
- 13.Certo M., Tsai C.H., Pucino V., Ho P.C., Mauro C. Lactate modulation of immune responses in inflammatory versus tumour microenvironments. Nat Rev Immunol. 2021;21(3):151–161. doi: 10.1038/s41577-020-0406-2. [DOI] [PubMed] [Google Scholar]
- 14.Zhang D., Tang Z., Huang H., Zhou G., Cui C., Weng Y., et al. Metabolic regulation of gene expression by histone lactylation. Nature. 2019;574(7779):575–580. doi: 10.1038/s41586-019-1678-1. [DOI] [PMC free article] [PubMed] [Google Scholar]
- 15.Faubert B., Li K.Y., Cai L., Hensley C.T., Kim J., Zacharias L.G., et al. Lactate Metabolism in Human Lung Tumors. Cell. 2017;171(2):358–371 e359. doi: 10.1016/j.cell.2017.09.019. [DOI] [PMC free article] [PubMed] [Google Scholar]
- 16.Husain Z., Huang Y., Seth P., Sukhatme V.P. Tumor-derived lactate modifies antitumor immune response: effect on myeloid-derived suppressor cells and NK cells. J Immunol. 2013;191(3):1486–1495. doi: 10.4049/jimmunol.1202702. [DOI] [PubMed] [Google Scholar]
- 17.Brand A., Singer K., Koehl G.E., Kolitzus M., Schoenhammer G., Thiel A., et al. LDHA-Associated Lactic Acid Production Blunts Tumor Immunosurveillance by T and NK Cells. Cell Metab. 2016;24(5):657–671. doi: 10.1016/j.cmet.2016.08.011. [DOI] [PubMed] [Google Scholar]
- 18.Bueno R., Richards W.G., Harpole D.H., Ballman K.V., Tsao M.S., Chen Z., et al. Multi-Institutional Prospective Validation of Prognostic mRNA Signatures in Early Stage Squamous Lung Cancer (Alliance) J Thorac Oncol. 2020;15(11):1748–1757. doi: 10.1016/j.jtho.2020.07.005. [DOI] [PMC free article] [PubMed] [Google Scholar]
- 19.Mermel C.H., Schumacher S.E., Hill B., Meyerson M.L., Beroukhim R., Getz G. GISTIC2.0 facilitates sensitive and confident localization of the targets of focal somatic copy-number alteration in human cancers. Genome Biol. 2011;12(4):R41. doi: 10.1186/gb-2011-12-4-r41. [DOI] [PMC free article] [PubMed] [Google Scholar]
- 20.Gaujoux R., Seoighe C. A flexible R package for nonnegative matrix factorization. BMC Bioinf. 2010;11:367. doi: 10.1186/1471-2105-11-367. [DOI] [PMC free article] [PubMed] [Google Scholar]
- 21.Hanzelmann S., Castelo R., Guinney J. GSVA: gene set variation analysis for microarray and RNA-seq data. BMC Bioinf. 2013;14:7. doi: 10.1186/1471-2105-14-7. [DOI] [PMC free article] [PubMed] [Google Scholar]
- 22.Jia Q., Wu W., Wang Y., Alexander P.B., Sun C., Gong Z., et al. Local mutational diversity drives intratumoral immune heterogeneity in non-small cell lung cancer. Nat Commun. 2018;9(1):5361. doi: 10.1038/s41467-018-07767-w. [DOI] [PMC free article] [PubMed] [Google Scholar]
- 23.Yoshihara K., Shahmoradgoli M., Martinez E., Vegesna R., Kim H., Torres-Garcia W., et al. Inferring tumour purity and stromal and immune cell admixture from expression data. Nat Commun. 2013;4:2612. doi: 10.1038/ncomms3612. [DOI] [PMC free article] [PubMed] [Google Scholar]
- 24.Mayakonda A., Lin D.C., Assenov Y., Plass C., Koeffler H.P. Maftools: efficient and comprehensive analysis of somatic variants in cancer. Genome Res. 2018;28(11):1747–1756. doi: 10.1101/gr.239244.118. [DOI] [PMC free article] [PubMed] [Google Scholar]
- 25.Rosenthal R., McGranahan N., Herrero J., Taylor B.S., Swanton C. DeconstructSigs: delineating mutational processes in single tumors distinguishes DNA repair deficiencies and patterns of carcinoma evolution. Genome Biol. 2016;17:31. doi: 10.1186/s13059-016-0893-4. [DOI] [PMC free article] [PubMed] [Google Scholar]
- 26.Love M.I., Huber W., Anders S. Moderated estimation of fold change and dispersion for RNA-seq data with DESeq2. Genome Biol. 2014;15(12):550. doi: 10.1186/s13059-014-0550-8. [DOI] [PMC free article] [PubMed] [Google Scholar]
- 27.Yu G., Wang L.G., Han Y., He Q.Y. clusterProfiler: an R package for comparing biological themes among gene clusters. OMICS. 2012;16(5):284–287. doi: 10.1089/omi.2011.0118. [DOI] [PMC free article] [PubMed] [Google Scholar]
- 28.Langfelder P., Horvath S. WGCNA: an R package for weighted correlation network analysis. BMC Bioinf. 2008;9:559. doi: 10.1186/1471-2105-9-559. [DOI] [PMC free article] [PubMed] [Google Scholar]
- 29.Newman A.M., Steen C.B., Liu C.L., Gentles A.J., Chaudhuri A.A., Scherer F., et al. Determining cell type abundance and expression from bulk tissues with digital cytometry. Nat Biotechnol. 2019;37(7):773–782. doi: 10.1038/s41587-019-0114-2. [DOI] [PMC free article] [PubMed] [Google Scholar]
- 30.Jiang P., Gu S., Pan D., Fu J., Sahu A., Hu X., et al. Signatures of T cell dysfunction and exclusion predict cancer immunotherapy response. Nat Med. 2018;24(10):1550–1558. doi: 10.1038/s41591-018-0136-1. [DOI] [PMC free article] [PubMed] [Google Scholar]
- 31.Charoentong P., Finotello F., Angelova M., Mayer C., Efremova M., Rieder D., et al. Pan-cancer Immunogenomic Analyses Reveal Genotype-Immunophenotype Relationships and Predictors of Response to Checkpoint Blockade. Cell Rep. 2017;18(1):248–262. doi: 10.1016/j.celrep.2016.12.019. [DOI] [PubMed] [Google Scholar]
- 32.Geeleher P., Cox N., Huang R.S. pRRophetic: an R package for prediction of clinical chemotherapeutic response from tumor gene expression levels. PLoS ONE. 2014;9(9):e107468. doi: 10.1371/journal.pone.0107468. [DOI] [PMC free article] [PubMed] [Google Scholar]
- 33.Lu H., Dalgard C.L., Mohyeldin A., McFate T., Tait A.S., Verma A. Reversible inactivation of HIF-1 prolyl hydroxylases allows cell metabolism to control basal HIF-1. J Biol Chem. 2005;280(51):41928–41939. doi: 10.1074/jbc.M508718200. [DOI] [PubMed] [Google Scholar]
- 34.Jing X., Yang F., Shao C., Wei K., Xie M., Shen H., et al. Role of hypoxia in cancer therapy by regulating the tumor microenvironment. Mol Cancer. 2019;18(1):157. doi: 10.1186/s12943-019-1089-9. [DOI] [PMC free article] [PubMed] [Google Scholar]
- 35.Rami-Porta R., Call S., Dooms C., Obiols C., Sanchez M., Travis W.D., et al. Lung cancer staging: a concise update. Eur Respir J. 2018;51(5) doi: 10.1183/13993003.00190-2018. [DOI] [PubMed] [Google Scholar]
- 36.Thorsson V., Gibbs D.L., Brown S.D., Wolf D., Bortone D.S., Ou Yang T.H., et al. The Immune Landscape of Cancer. Immunity. 2018;48(4):812–830 e814. doi: 10.1016/j.immuni.2018.03.023. [DOI] [PMC free article] [PubMed] [Google Scholar]
- 37.Locati M., Curtale G., Mantovani A. Diversity, Mechanisms, and Significance of Macrophage Plasticity. Annu Rev Pathol. 2020;15:123–147. doi: 10.1146/annurev-pathmechdis-012418-012718. [DOI] [PMC free article] [PubMed] [Google Scholar]
- 38.Lin Y., Xu J., Lan H. Tumor-associated macrophages in tumor metastasis: biological roles and clinical therapeutic applications. J Hematol Oncol. 2019;12(1):76. doi: 10.1186/s13045-019-0760-3. [DOI] [PMC free article] [PubMed] [Google Scholar]
- 39.La Fleur L., Falk-Sorqvist E., Smeds P., Berglund A., Sundstrom M., Mattsson J.S., et al. Mutation patterns in a population-based non-small cell lung cancer cohort and prognostic impact of concomitant mutations in KRAS and TP53 or STK11. Lung Cancer. 2019;130:50–58. doi: 10.1016/j.lungcan.2019.01.003. [DOI] [PubMed] [Google Scholar]
- 40.Bagchi S., Yuan R., Engleman E.G. Immune Checkpoint Inhibitors for the Treatment of Cancer: Clinical Impact and Mechanisms of Response and Resistance. Annu Rev Pathol. 2021;16:223–249. doi: 10.1146/annurev-pathol-042020-042741. [DOI] [PubMed] [Google Scholar]
- 41.Fan X., Quezada S.A., Sepulveda M.A., Sharma P., Allison J.P. Engagement of the ICOS pathway markedly enhances efficacy of CTLA-4 blockade in cancer immunotherapy. J Exp Med. 2014;211(4):715–725. doi: 10.1084/jem.20130590. [DOI] [PMC free article] [PubMed] [Google Scholar]
- 42.Hui E., Cheung J., Zhu J., Su X., Taylor M.J., Wallweber H.A., et al. T cell costimulatory receptor CD28 is a primary target for PD-1-mediated inhibition. Science. 2017;355(6332):1428–1433. doi: 10.1126/science.aaf1292. [DOI] [PMC free article] [PubMed] [Google Scholar]
- 43.Kamphorst A.O., Wieland A., Nasti T., Yang S., Zhang R., Barber D.L., et al. Rescue of exhausted CD8 T cells by PD-1-targeted therapies is CD28-dependent. Science. 2017;355(6332):1423–1427. doi: 10.1126/science.aaf0683. [DOI] [PMC free article] [PubMed] [Google Scholar]
- 44.Rizwan A., Serganova I., Khanin R., Karabeber H., Ni X., Thakur S., et al. Relationships between LDH-A, lactate, and metastases in 4T1 breast tumors. Clin Cancer Res. 2013;19(18):5158–5169. doi: 10.1158/1078-0432.CCR-12-3300. [DOI] [PMC free article] [PubMed] [Google Scholar]
- 45.Xie H., Hanai J., Ren J.G., Kats L., Burgess K., Bhargava P., et al. Targeting lactate dehydrogenase–a inhibits tumorigenesis and tumor progression in mouse models of lung cancer and impacts tumor-initiating cells. Cell Metab. 2014;19(5):795–809. doi: 10.1016/j.cmet.2014.03.003. [DOI] [PMC free article] [PubMed] [Google Scholar]
- 46.Rooney M.S., Shukla S.A., Wu C.J., Getz G., Hacohen N. Molecular and genetic properties of tumors associated with local immune cytolytic activity. Cell. 2015;160(1–2):48–61. doi: 10.1016/j.cell.2014.12.033. [DOI] [PMC free article] [PubMed] [Google Scholar]
- 47.DePeaux K., Delgoffe G.M. Metabolic barriers to cancer immunotherapy. Nat Rev Immunol. 2021;21(12):785–797. doi: 10.1038/s41577-021-00541-y. [DOI] [PMC free article] [PubMed] [Google Scholar]
- 48.Le Floch R., Chiche J., Marchiq I., Naiken T., Ilc K., Murray C.M., et al. CD147 subunit of lactate/H+ symporters MCT1 and hypoxia-inducible MCT4 is critical for energetics and growth of glycolytic tumors. Proc Natl Acad Sci U S A. 2011;108(40):16663–16668. doi: 10.1073/pnas.1106123108. [DOI] [PMC free article] [PubMed] [Google Scholar]
- 49.Hong C.S., Graham N.A., Gu W., Espindola Camacho C., Mah V., Maresh E.L., et al. MCT1 Modulates Cancer Cell Pyruvate Export and Growth of Tumors that Co-express MCT1 and MCT4. Cell Rep. 2016;14(7):1590–1601. doi: 10.1016/j.celrep.2016.01.057. [DOI] [PMC free article] [PubMed] [Google Scholar]
- 50.Zdralevic M., Vucetic M., Daher B., Marchiq I., Parks S.K., Pouyssegur J. Disrupting the 'Warburg effect' re-routes cancer cells to OXPHOS offering a vulnerability point via 'ferroptosis'-induced cell death. Adv Biol Regul. 2018;68:55–63. doi: 10.1016/j.jbior.2017.12.002. [DOI] [PubMed] [Google Scholar]
- 51.Dorneburg C., Fischer M., Barth T.F.E., Mueller-Klieser W., Hero B., Gecht J., et al. LDHA in Neuroblastoma Is Associated with Poor Outcome and Its Depletion Decreases Neuroblastoma Growth Independent of Aerobic Glycolysis. Clin Cancer Res. 2018;24(22):5772–5783. doi: 10.1158/1078-0432.CCR-17-2578. [DOI] [PubMed] [Google Scholar]
Associated Data
This section collects any data citations, data availability statements, or supplementary materials included in this article.