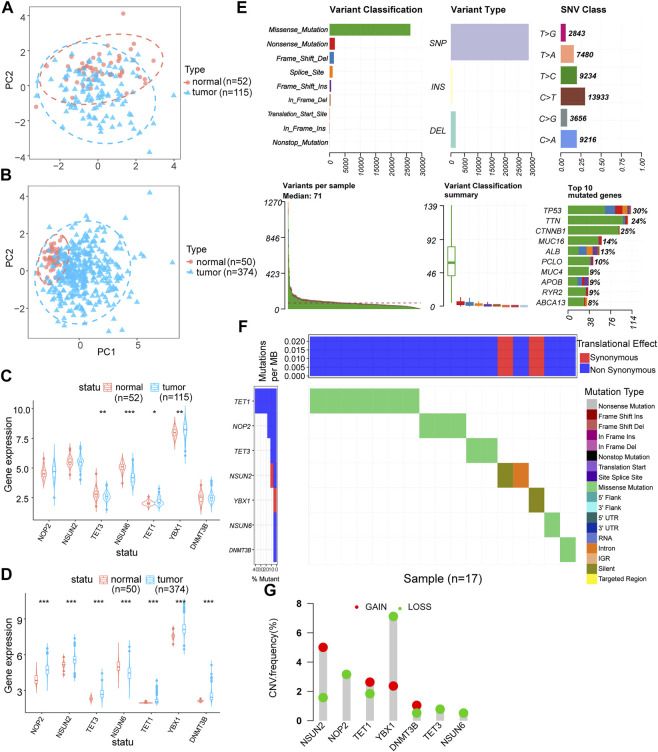
FIGURE 1.
m5C regulator genes analysis. (A,B): PCA analysis of GEO and TCGA expression matrices after data correction, blue represents tumor samples (GEO: n = 115, TCGA: n = 374) and red represents control samples (GEO: n = 52, TCGA: n = 50); (C,D): differential expression analysis of m5C regulator genes in GEO and TCGA expression matrices after data correction, blue represents tumor samples (GEO: n = 115, TCGA: n = 374) and red represents control samples (GEO: n = 52, TCGA: n = 50); (E): mutation profile of m5C regulator genes in hepatocellular carcinoma; (F): m5C-related regulators SNV mutation category and frequency; (G): m5C regulator genes CNV amplification and deletion.

