FIGURE 2.
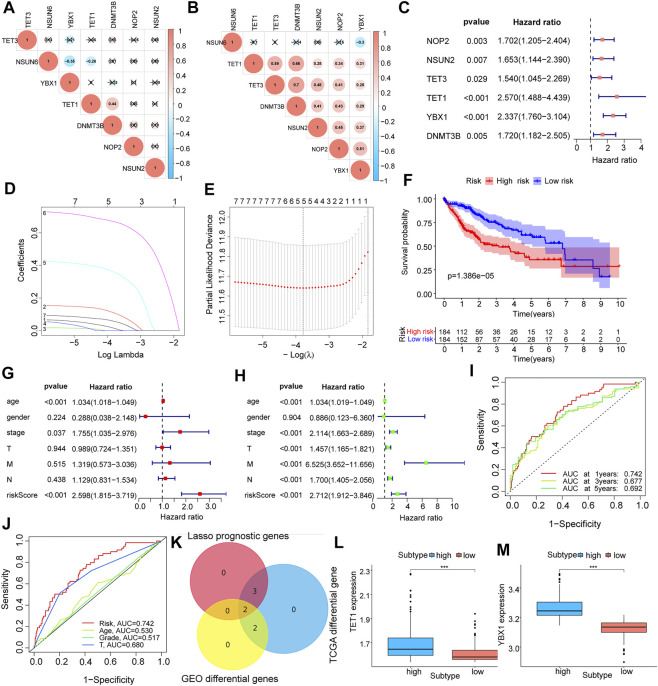
Expression characteristics and prognostic model construction of m5C regulator genes in hepatocellular carcinoma. (A,B): m5C regulator genes co-expression analysis in the corrected GEO (A) and TCGA (B) expression matrices; (C): identify m5C regulator genes associated with prognosis by univariate COX regression analysis, forest plots show the screened genes; (D,E): show the regression coefficients in the LASSO regression algorithm and the cross-validation in the proportional risk model to adjust the parameter, finalize the best parameter(λ) to screen the most relevant genes for hepatocellular carcinoma; (F): survival analysis of different LASSO subgroups; (G,H): multivariate and univariate analysis of risk scores combined with clinical factors such as patient age, gender, and TNM stage; (I,J): AUC analysis of prognostic model and clinical characteristics; (K): Venn diagram mapping of differential genes in GEO and TCGA liver cancer samples and the intersection of genes screened out by LASSO; (L,M): expression of key genes TET1 and YBX1 in each LASSO subgroups.

