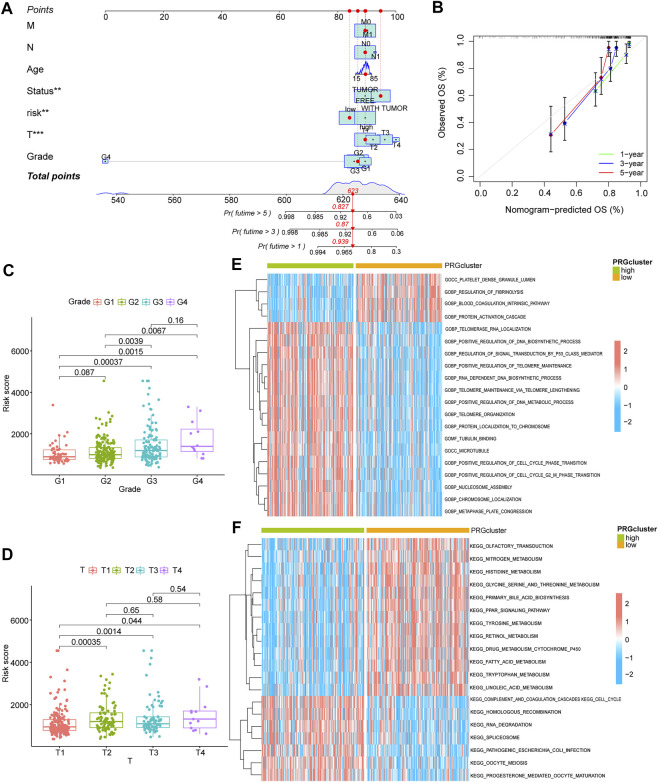
FIGURE 3.
Clinical analysis and GSVA analysis of the prognostic model. (A) risk score combined with clinical indicators to draw nomogram; (B) comparison of predicted survival time and actual survival time using nomogram; (C,D): correlation analysis for G-stage and T-stage, respectively; (E,F): GSVA-GO analysis (E) and GSVA-KEGG analysis (F) for high and low-risk group.

